
Demand forecasting that starts with the best model for every pattern
Horizon matches every pattern to its own best-fit model, publishing a baseline that already cuts forecast error by 21-34%.
Before it locks in, planners can test a what-if scenario and see the impact right away. And if the data misses something, they can override it directly, no waiting on anyone.
Before it locks in, planners can test a what-if scenario and see the impact right away. And if the data misses something, they can override it directly, no waiting on anyone.
Horizon generates the baseline with the best model for every demand pattern
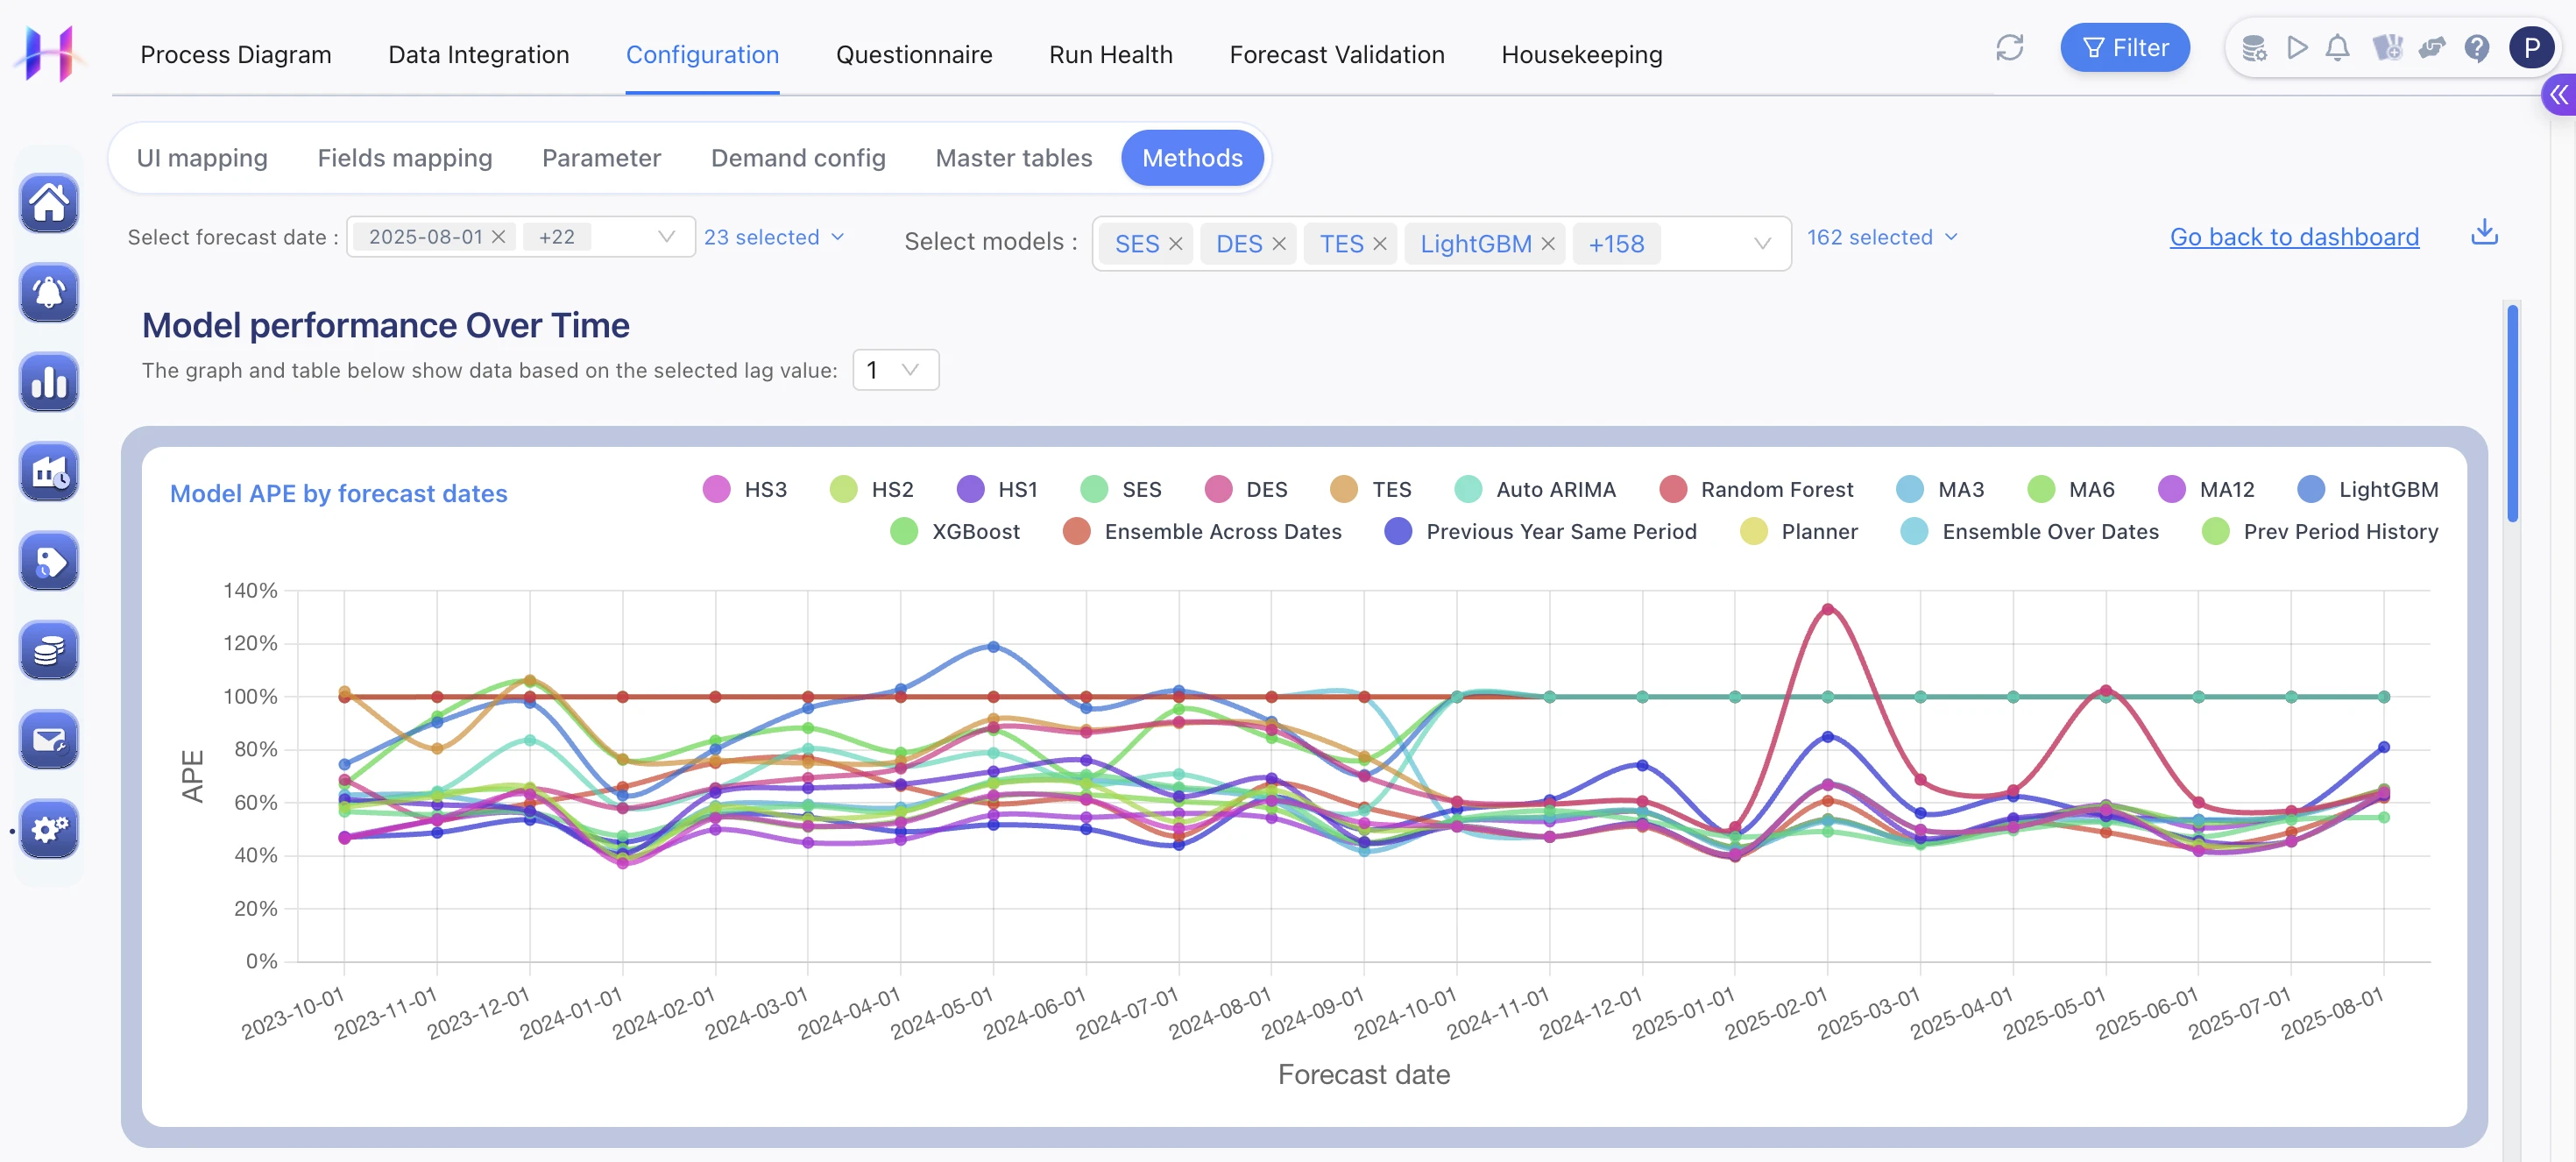
- Horizon runs statistical, machine learning, causal, and Horizon-built models against every product, customer, and location pattern.
- The best model gets picked automatically by Horizon based on accuracy, bias, and stability, and stays current as new data arrives.
- Why did the model change? Horizon shows which features mattered most, and flags the forecasts it's least confident in.
- Planners can adjust the forecast or test a what-if scenario against the baseline, each with a reason code that guards against unmanaged bias.
Horizon explains demand behaviour, segments, and hidden drivers automatically
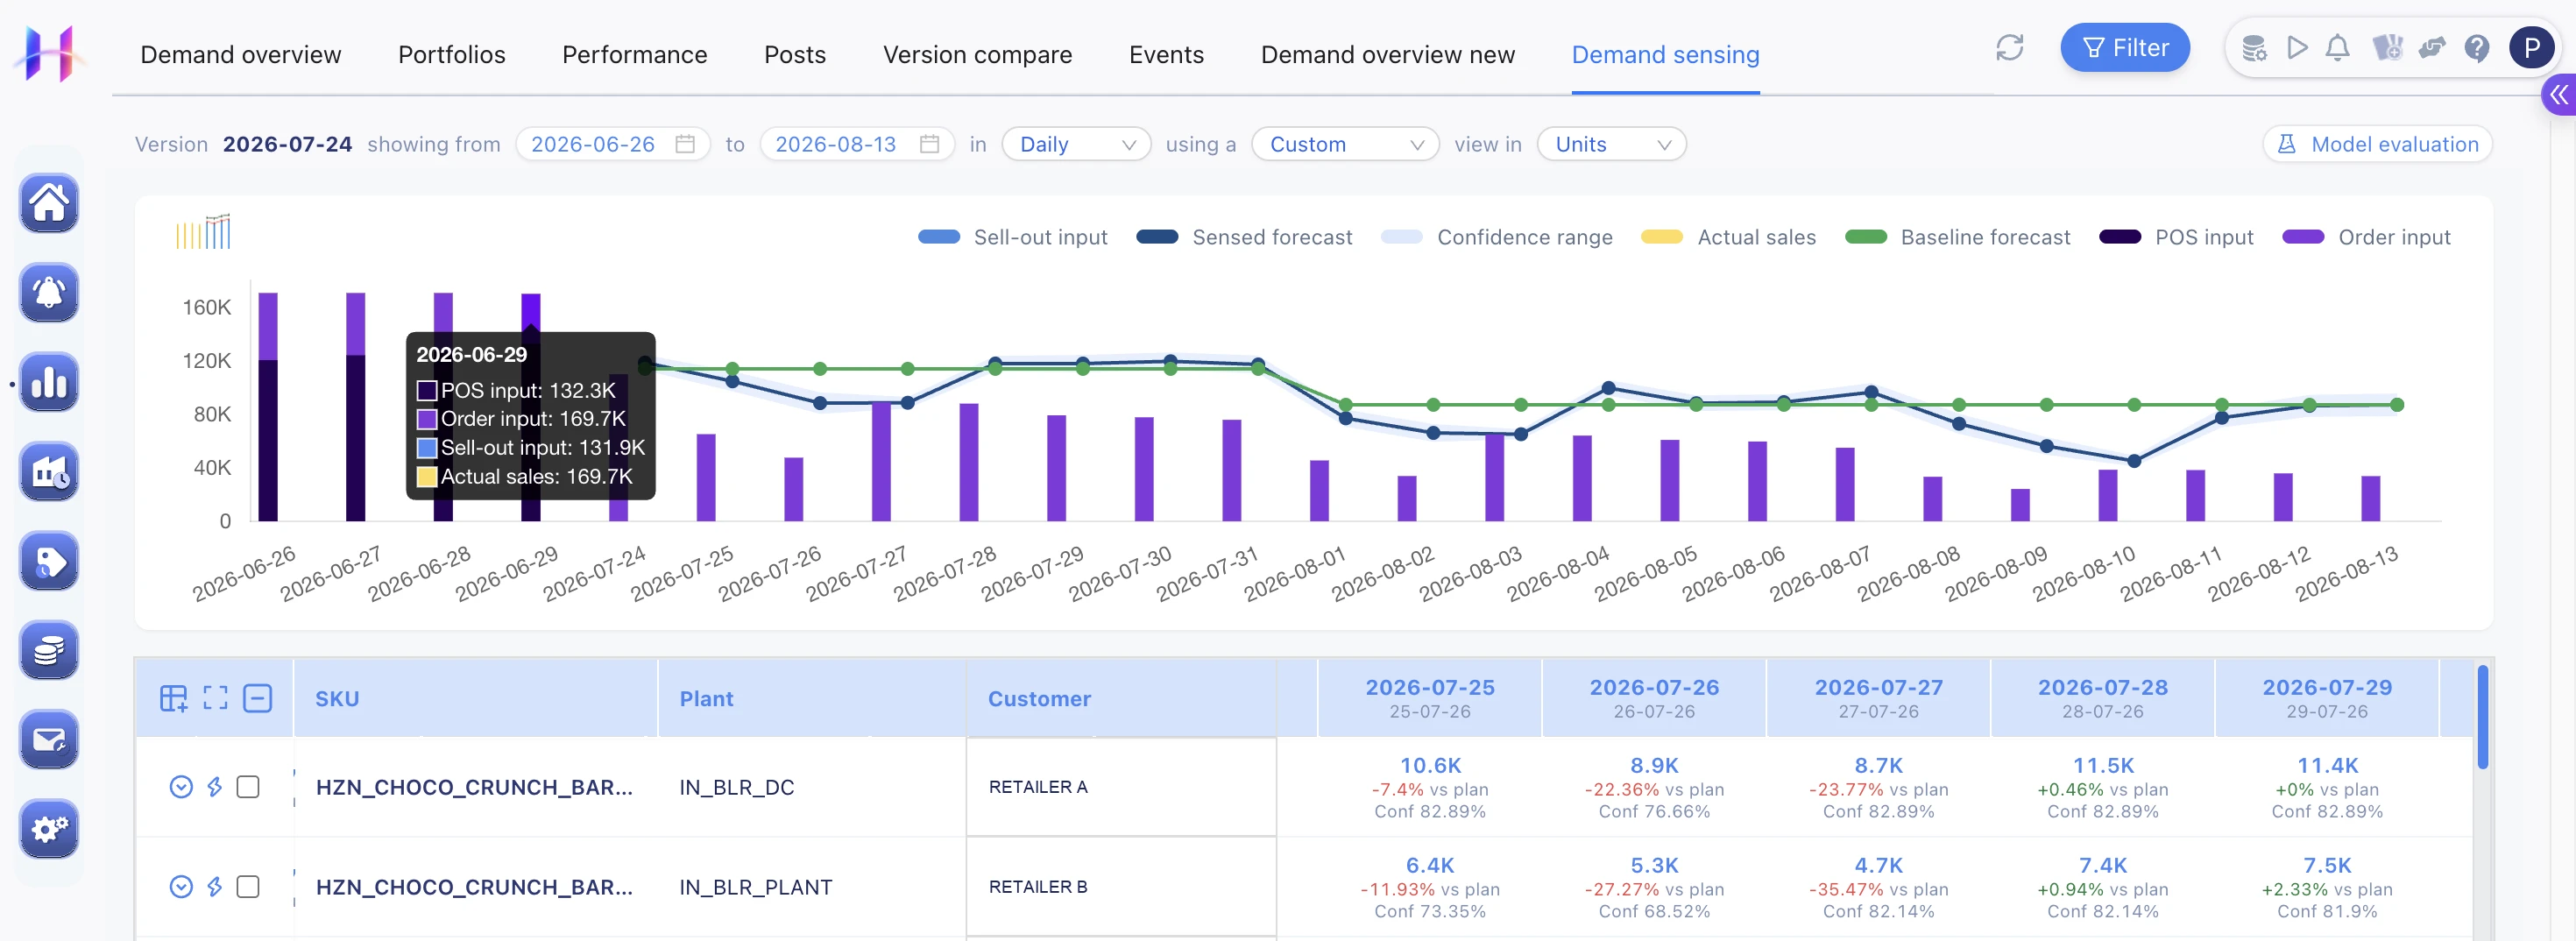
- Horizon clusters products and customers by volatility, growth, seasonality, and value.
- When demand moves, Horizon pinpoints which factor, price, an event, a customer, the market, or supply, is behind it.
- Not every shift is real: Horizon separates an actual demand change from noise, a data issue, or a one-off event.
Horizon's AI proactively recommends the next action and flags the biggest risks, before planners even ask
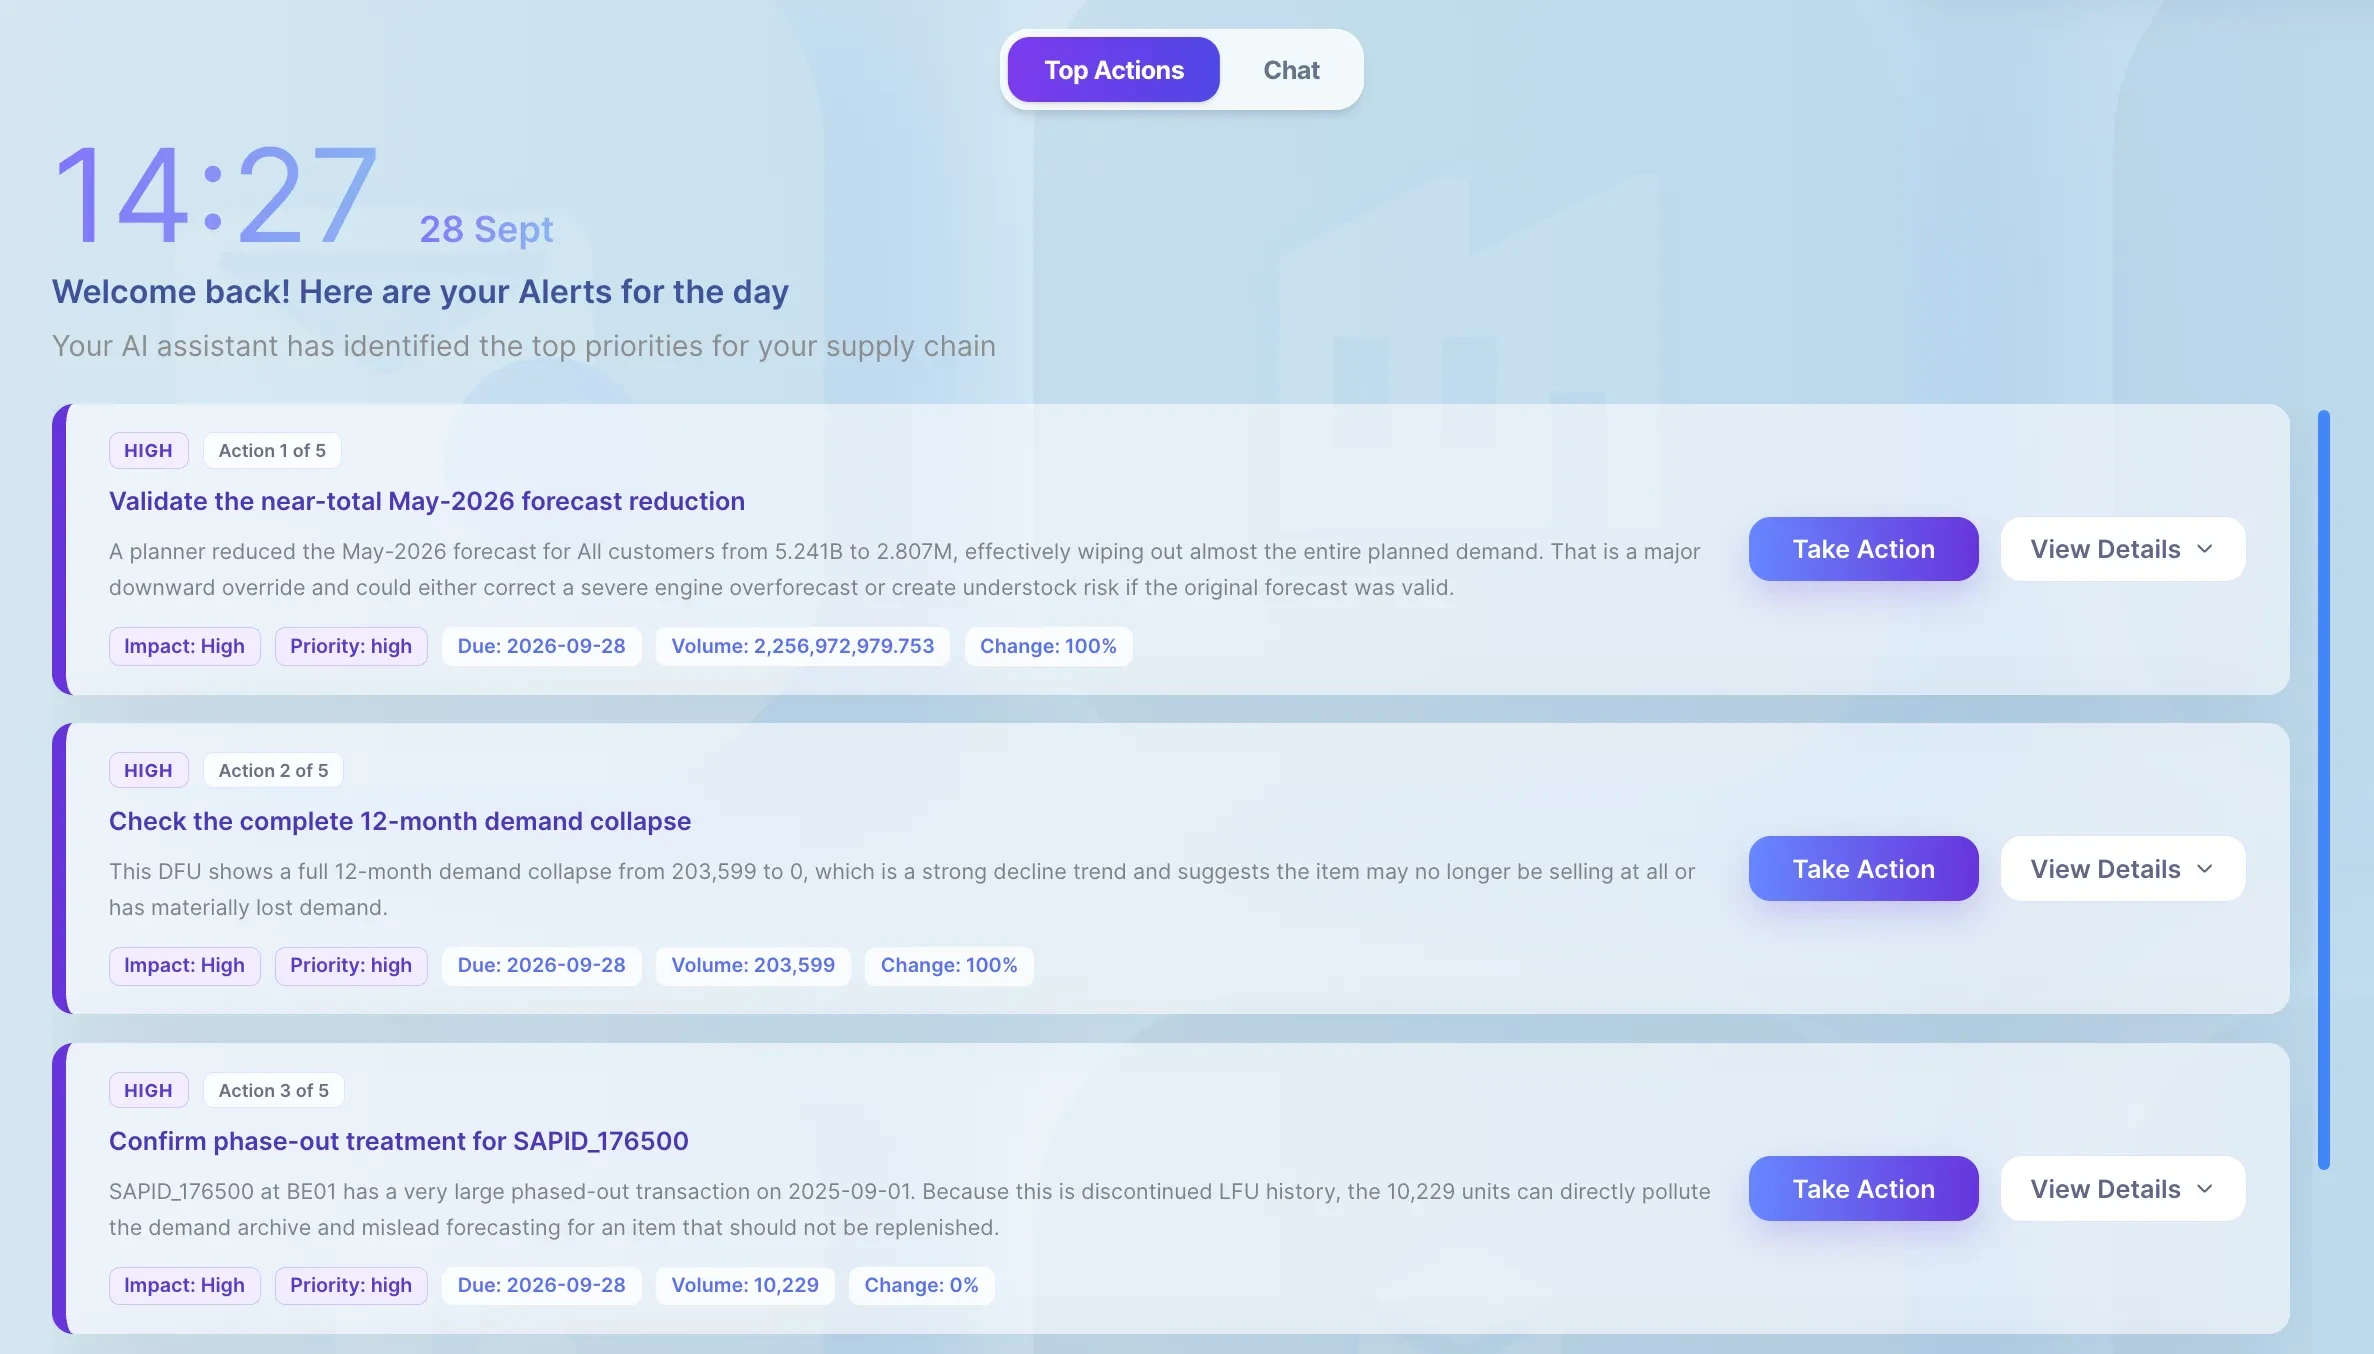
- Horizon ranks each recommendation by impact and priority, so the biggest risks surface first instead of getting buried.
- Horizon suggests the next action based on how a specific segment is behaving right now.
- Planners can ask a plain-language question about demand movement and get an explainable answer.
- Horizon feeds outcomes back in, so recommendation quality improves every cycle.
Horizon aggregates and disaggregates demand across every hierarchy level
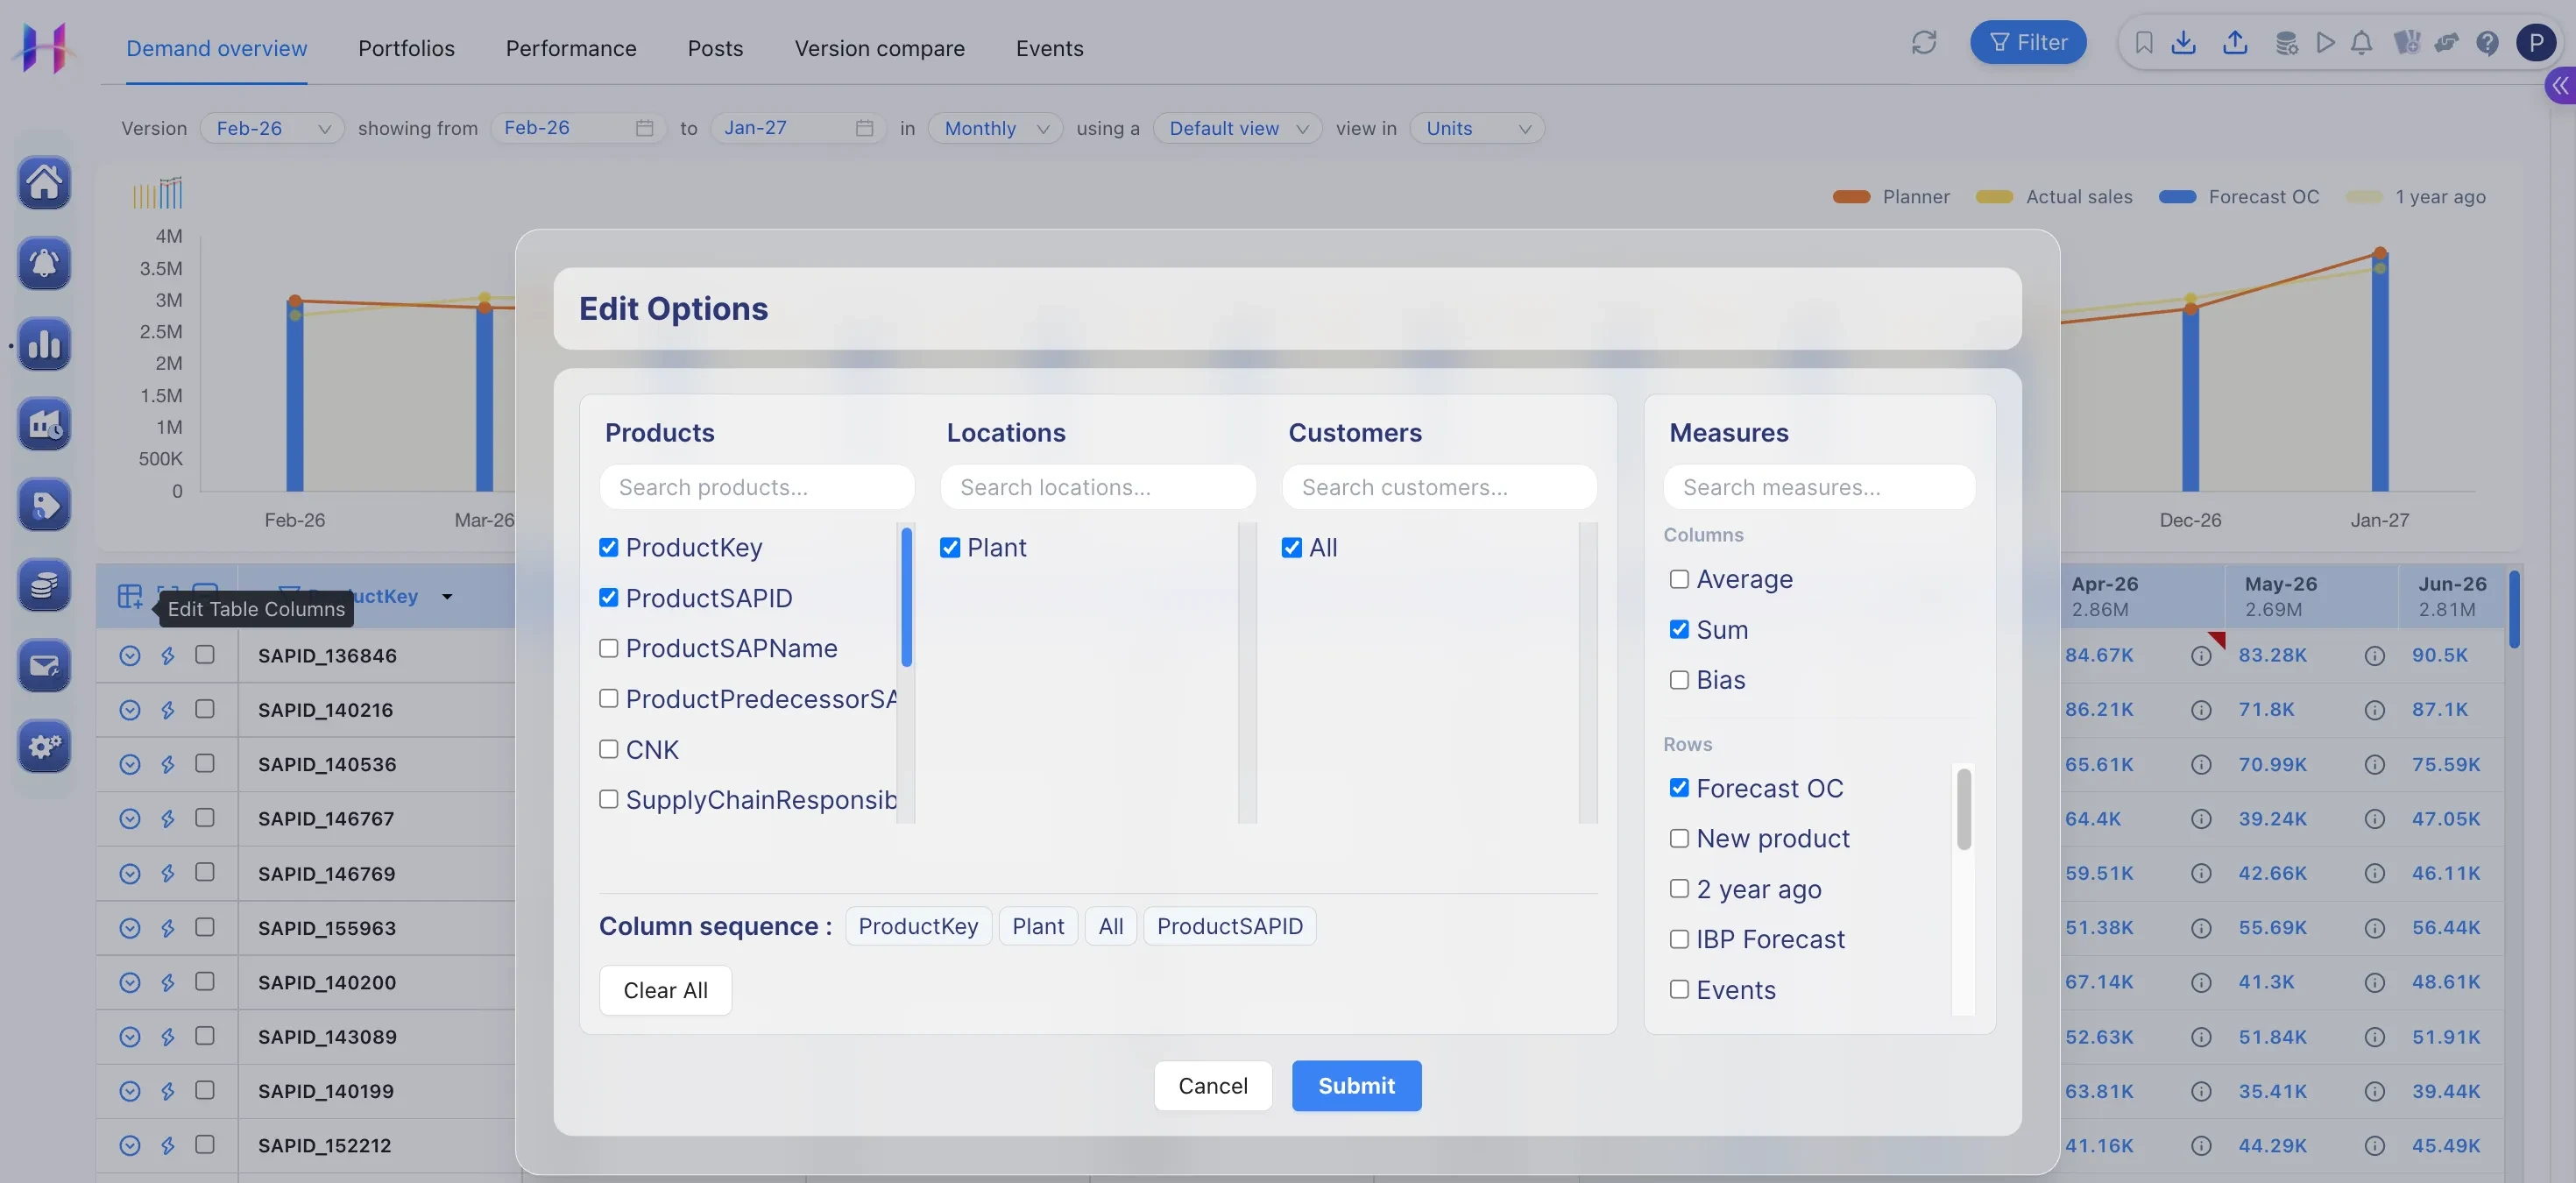
- Horizon aggregates demand from SKU up through category, customer, and location for an executive view, and disaggregates it just as easily going the other way.
- From finished-goods requirements, Horizon also calculates dependent demand.
- The granular number doesn't stay at ground level: Horizon connects it to S&OP, budget, and leadership review.
Planners compare any two forecast versions and see exactly where they diverge
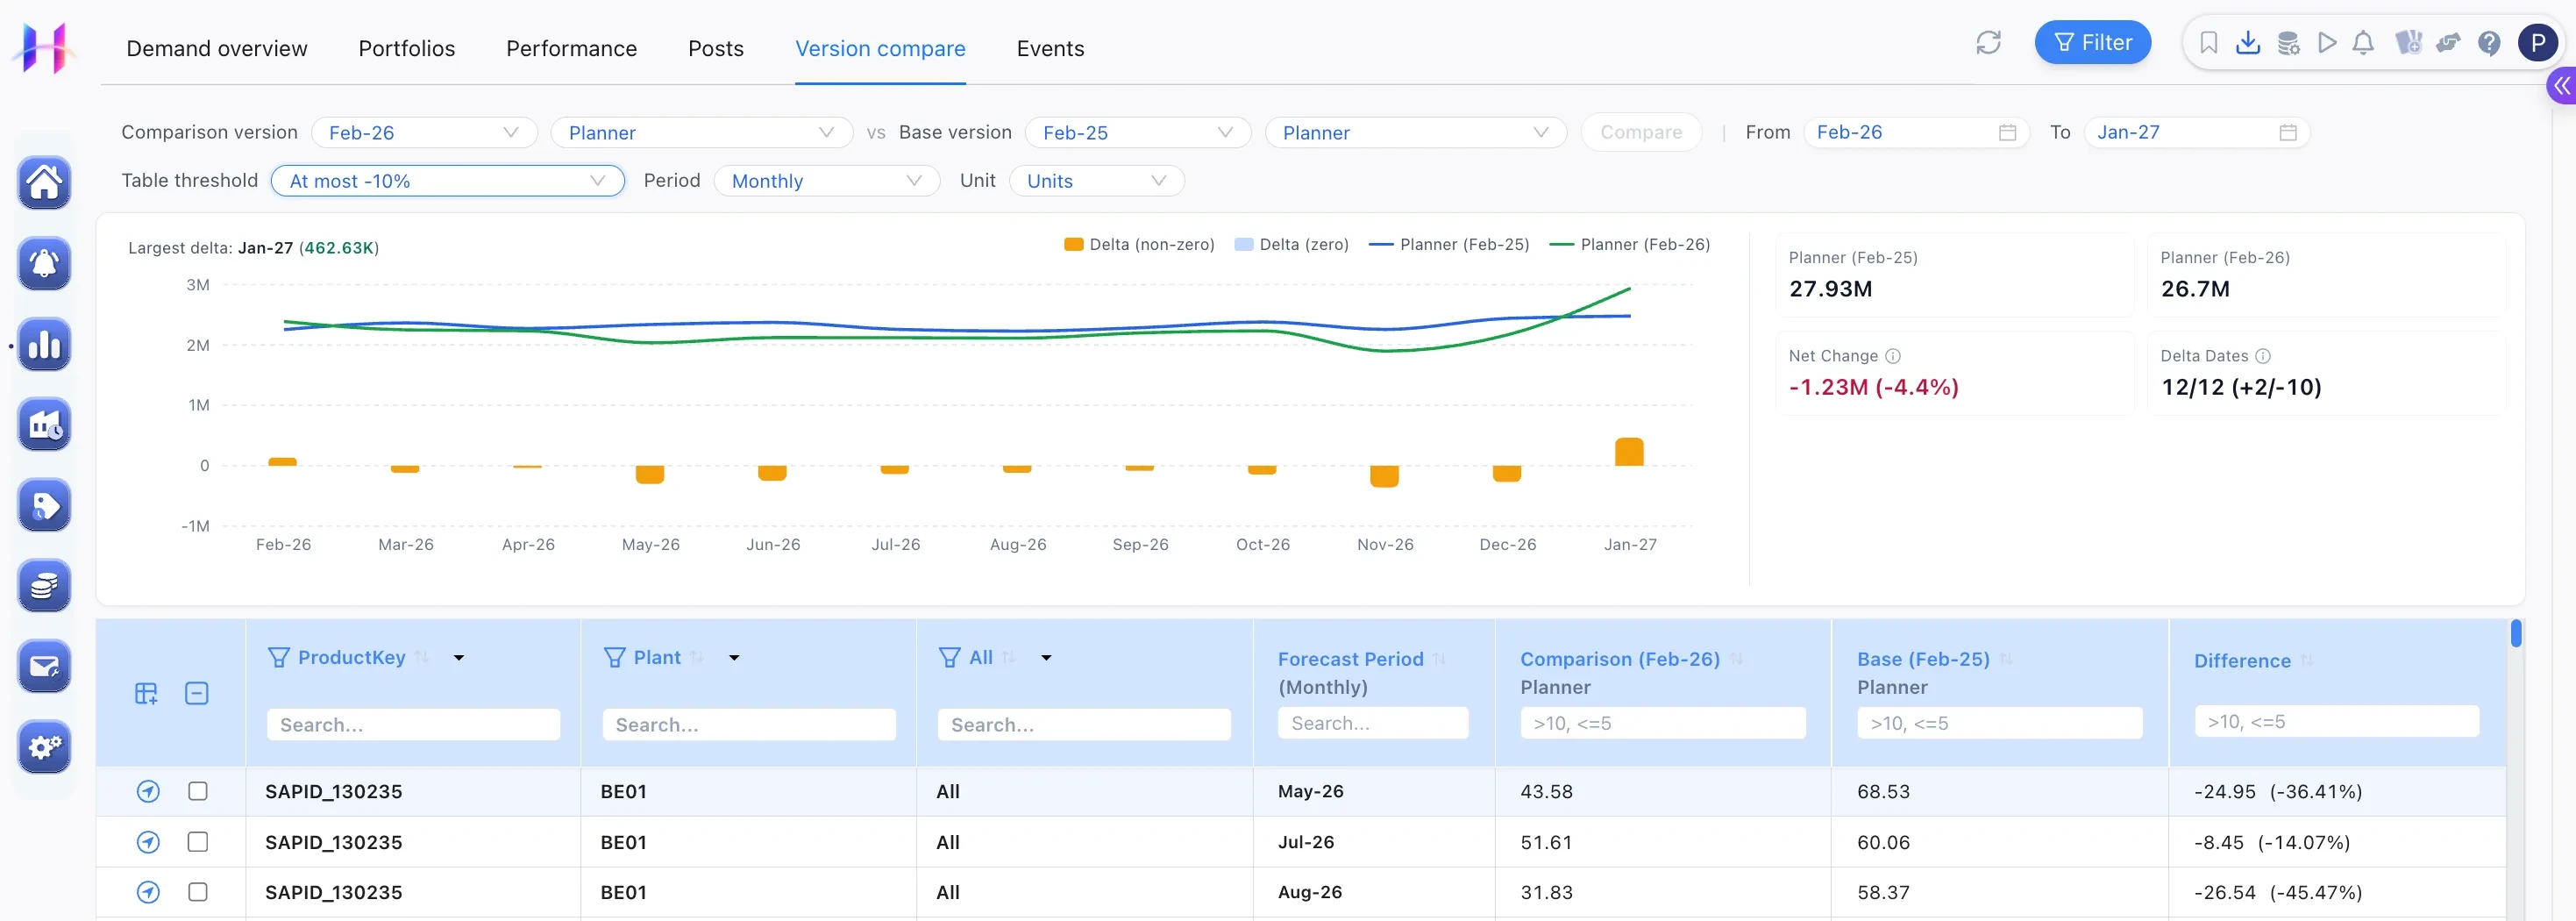
- Planners can compare any two saved sources, planner input, forecast engine output, or a prior version, across a custom date range.
- Horizon surfaces only the items where the change exceeds a set percentage, instead of scanning every line for what moved.
- Horizon calls out the largest delta automatically, with trend lines for both versions and a variance chart by period.
Horizon measures forecast accuracy against actuals across every past period and lead time
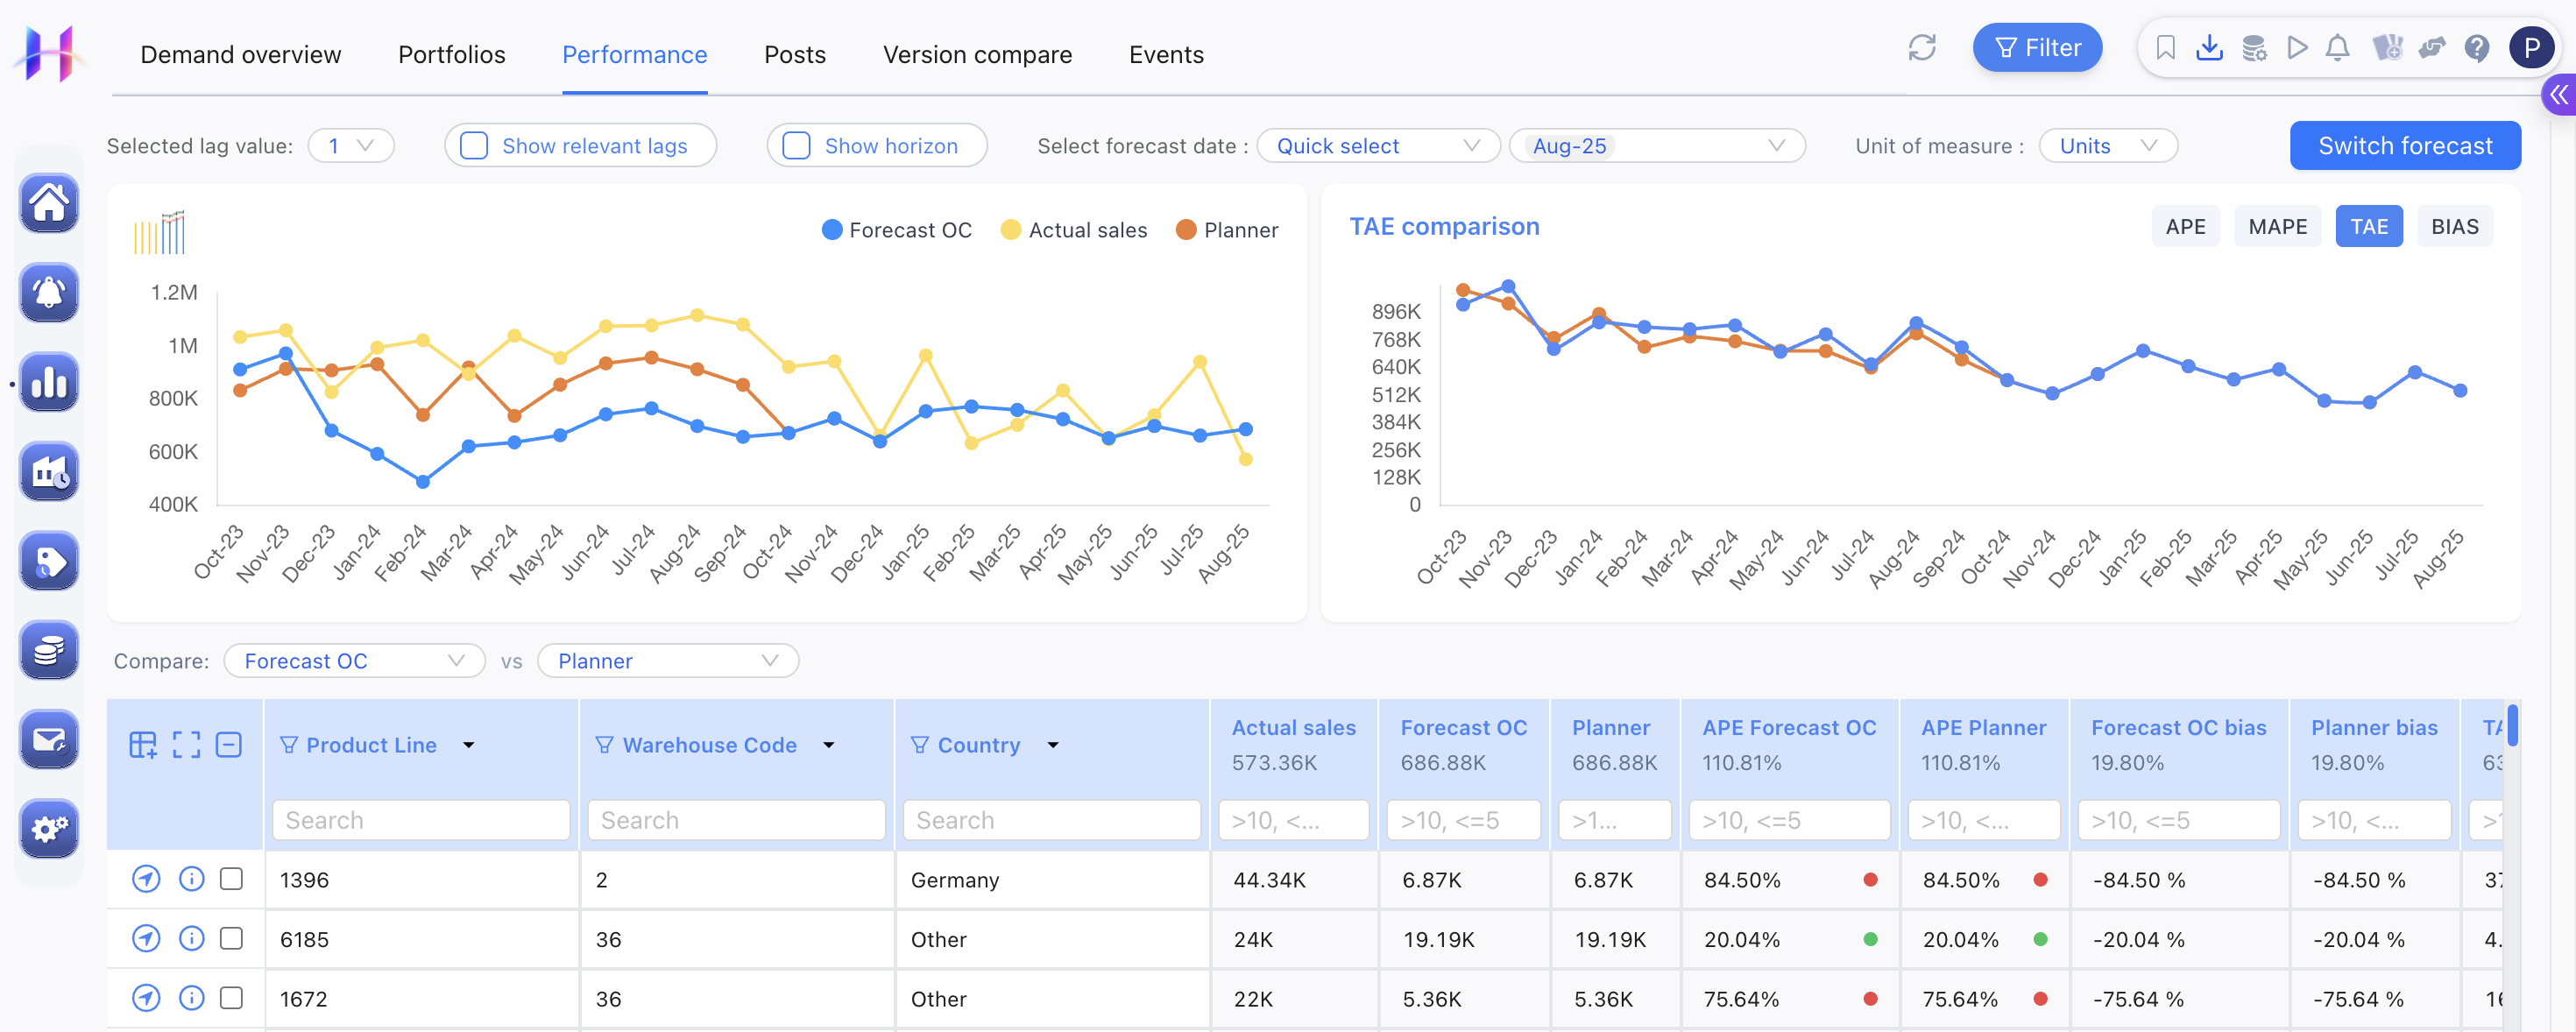
- Horizon tracks multiple accuracy metrics, APE, MAPE, and TAE, plus directional bias, viewable by lag or forecast horizon.
- Planners can compare the algorithm's own forecast against their manual number to see which one actually performed better.
- Horizon shows exactly where accuracy holds up and where it doesn't, whether that's by SKU, product line, warehouse, or customer, instead of one aggregate number.
Why supply chain planning leaders recommend us
Real stories from supply chain planning leaders who've faced the same stockouts, inventory waste, and manual workarounds you have.

Furniture Manufacturer
“Impressed by the knowledge and fast results of Horizon. Together we turned plans into action in no time.”

Olivier Van HoefSupply Chain Manager at Ahrend

Business Consulting and Services
“After 40+ years of implementing different planning tools, Horizon is by far the easiest to set up and adapt. It combines strong models with a flexibility we haven't seen elsewhere.”

Alex YoungDirector at Demand Integration

Urban Gardening Retailer
“What stood out was how quickly our team could use Horizon and how easily it was integrated with our current systems: the planning team saw the impact on their day-to-day immediately, and it improved collaboration and decision-making from a management perspective.”

Siddhant BhalingeCEO at Ugaoo
Frequently Asked Questions
Find quick answers to the most common questions about demand forecasting.
