Most mid-market manufacturers and distributors have meaningful working capital tied up in inventory that doesn't need to be there — but cutting it carelessly damages service levels and creates worse problems. The question isn't whether working capital can be reduced; in most companies, it can. The question is how to reduce it without service consequences.
This guide covers practical approaches to working capital reduction that preserve or improve service levels. The techniques apply across platforms — they're methodology, not vendor-specific features.
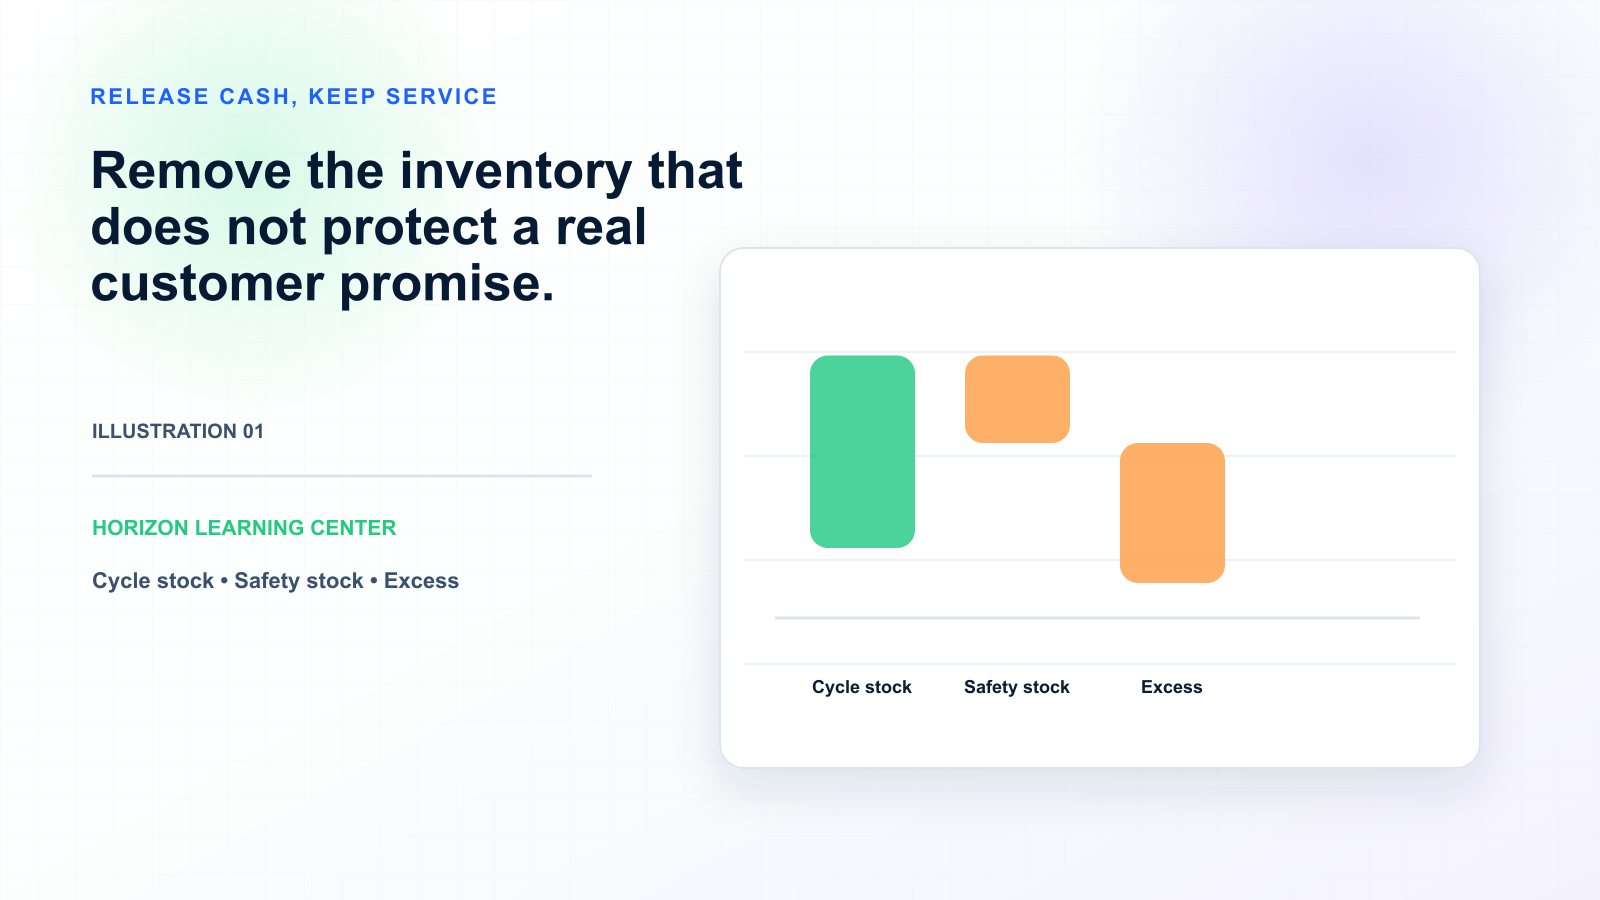
Horizon supports working capital reduction through: stochastic safety stock calculations handling non-normal demand and lead time variability, probabilistic methods for slow-moving SKUs with intermittent demand, segmented service levels by SKU class and location, multi-echelon inventory optimization (MEIO) for multi-location networks, integrated forecasting and order planning that prevents the misalignment building excess inventory, and inventory aging analysis surfacing stuck working capital.
The honest qualifier: working capital reduction is methodology more than platform. Companies achieve substantial reduction with structured analysis even in Excel-based environments. Platforms make the work easier and more sustainable but don't substitute for the analytical and organizational work. Horizon supports the work; the reduction comes from disciplined practice.

Working capital tied up in inventory is capital not available for other uses — growth investment, debt reduction, dividends. For mid-market manufacturers ($100M-$3B revenue), inventory typically represents 15-25% of revenue, meaning $15-75M of working capital. Even modest reductions (10-15%) release $2-12M in working capital. The financial impact is real.
The operational dimension: inventory carries cost beyond capital tied up. Carrying cost (storage, insurance, obsolescence risk) typically runs 18-28% of inventory value annually. So a $50M inventory position costs $9-14M annually beyond the capital cost. Reduction delivers both balance sheet improvement and ongoing P&L improvement.
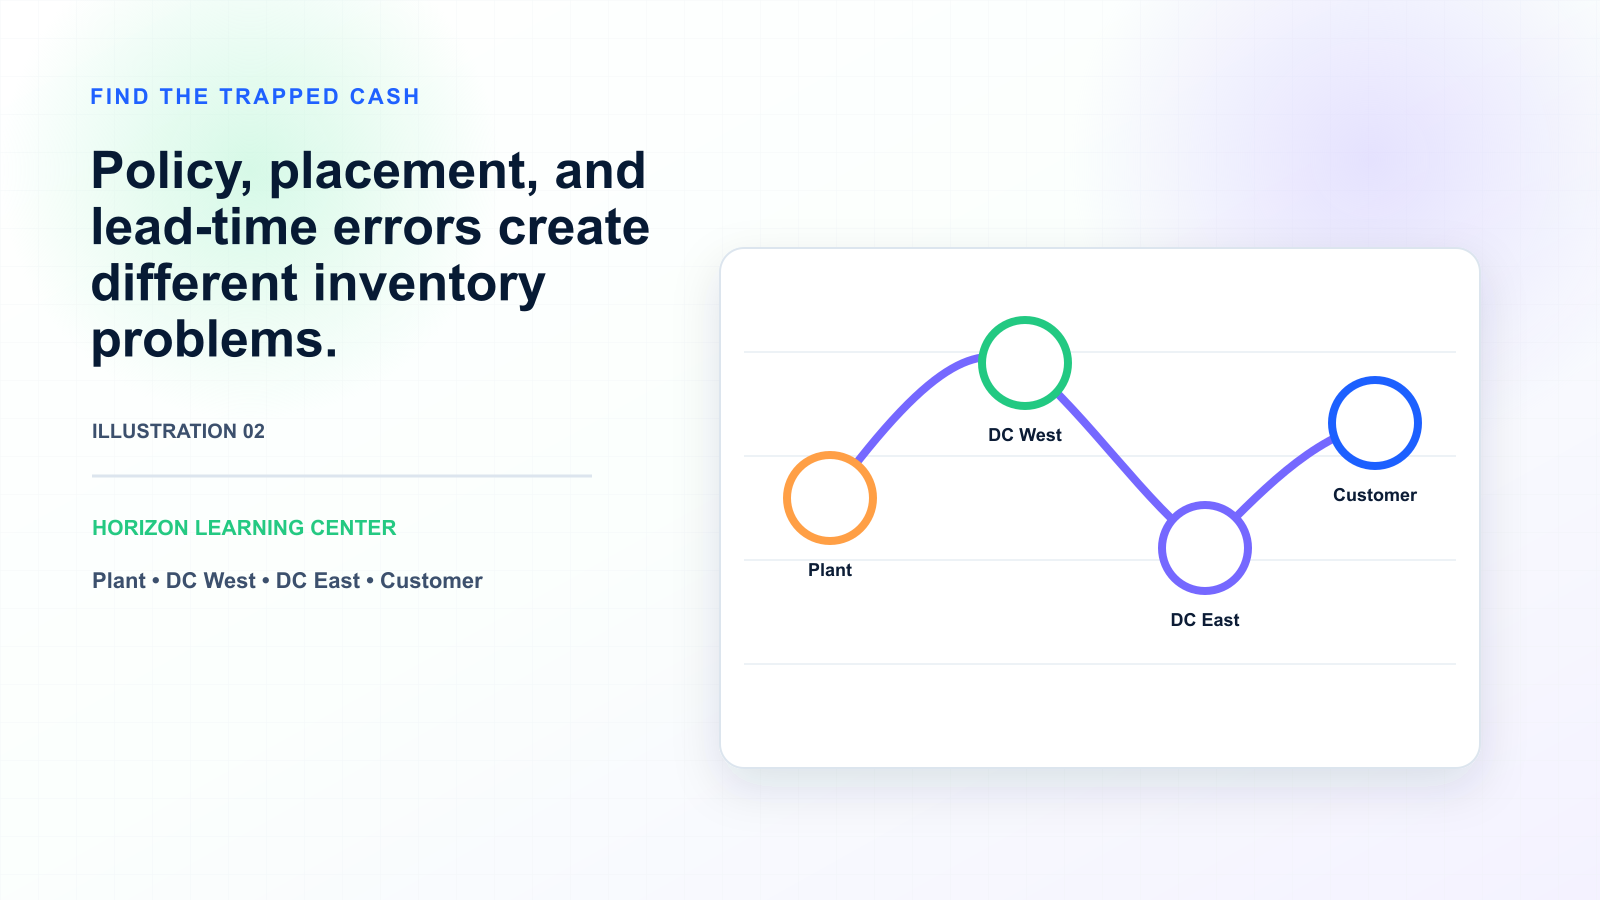
Traditional safety stock formulas (often Excel-based) assume normal demand distribution and treat lead time as constant. Both assumptions are typically wrong: real demand distributions are often skewed (more upside variability than downside), and lead times vary significantly especially with global supply chains. Deterministic formulas using these assumptions systematically over-estimate safety stock needs.
The fix: stochastic safety stock calculations that handle non-normal demand distributions and lead time variability. Modern platforms (Horizon, ToolsGroup, Logility, RELEX, SAP IBP) deliver this natively. The typical reduction: 10-25% safety stock at the same service levels, which translates to meaningful working capital release.
Many companies set service levels uniformly across SKUs (95% across the board, for example). This systematically over-invests in C-class SKUs (low value, low criticality) and under-invests in A-class SKUs (high value, high criticality). Both directions cost money: over-investment in C-class ties up working capital that delivers little revenue protection; under-investment in A-class creates service failures on the SKUs that matter most.
The fix: segmented service levels by SKU class. A-class SKUs (top 20% by revenue or criticality) at 98%+, B-class at 95%, C-class at 90%. The reallocation typically reduces total inventory while improving service on important SKUs.
Slow-moving SKUs (low velocity, intermittent demand patterns) often carry safety stock calculated as if they were normal-moving. Statistical safety stock methods assume regular demand patterns. Slow-moving SKUs violate this assumption — their demand is often intermittent (long gaps with occasional orders) rather than continuous. Standard safety stock formulas systematically over-provision these SKUs.
The fix: probabilistic methods for intermittent demand (Croston's method, Syntetos-Boylan-Approximation, or Bayesian approaches). Modern platforms include these methods specifically for slow-moving items. Typical impact: 30-50% safety stock reduction on slow-moving SKUs while maintaining service levels.
If forecasts and replenishment orders aren't well coordinated, inventory builds up. Common patterns: orders placed based on simple reorder points without forecast input, forecast updates that don't propagate to open orders, manual order quantities that don't reflect current demand patterns. The result is inventory that doesn't match current demand reality.
The fix: integrated planning where forecasts drive order recommendations and order modifications propagate back through the planning chain. Modern integrated platforms deliver this natively. Reactive approaches (place orders, then forecast) typically build up excess inventory over time.
Multi-location operations can have correct total inventory but wrong positioning — too much in some locations, too little in others (covered separately in inventory imbalance content). The fix: multi-echelon inventory optimization (MEIO) that positions inventory at the right network level. Often delivers 10-20% network inventory reduction while improving service.
If forecast accuracy is genuinely poor, organizations build excess inventory as protection. The relationship matters: forecast accuracy improvements typically reduce safety stock requirements proportionally. 5 percentage points of MAPE improvement (e.g., from 65% accuracy to 70%) typically translates to 8-15% safety stock reduction at the same service levels.
The fix: address forecast accuracy fundamentals (ensemble methods, FVA discipline, data quality) before assuming inventory buffer is needed. Companies sometimes carry inventory to compensate for forecasting that could be improved.
Inventory aging is a common hidden working capital trap. SKUs that haven't moved in 6-12 months may not move in the next 6-12 months. Inventory aging analysis identifies stock that should be cleared (markdown, return, write-off) rather than carried. Many companies hold significant working capital in items that have effectively become obsolete.
The fix: structured inventory aging review with defined thresholds for clearance action. Often a one-time exercise that releases 5-15% of total inventory working capital.
Working capital reduction is typically a multi-quarter effort, not a single exercise. The healthy sequence: (1) Diagnose where working capital hides through inventory aging analysis, safety stock review, service level segmentation review. (2) Address the largest opportunities first — typically slow-moving SKU over-provisioning, deterministic safety stock formulas, service level segmentation. (3) Implement integrated planning if currently fragmented. (4) Implement MEIO for multi-location networks. (5) Establish ongoing monitoring to prevent regression.
Most mid-market manufacturers can reduce working capital 15-25% over 12-18 months through this sequence while maintaining or improving service levels. Larger reductions (30%+) are possible but typically require addressing fundamental issues (network design, supplier relationships, demand variability sources) that go beyond inventory optimization alone.