Companies typically have realistic forecast accuracy improvement potential of 5-15 percentage points of MAPE from their current baseline. The improvement requires disciplined work across multiple dimensions — not a single fix. The honest framing: forecast accuracy is bounded by inherent demand variability, and no platform makes uncertain demand certain. But most companies operate well below their achievable accuracy because they haven't done the methodical work.
This guide covers the practical work that delivers improvement. The techniques apply across platforms — they're methodology, not vendor-specific features.
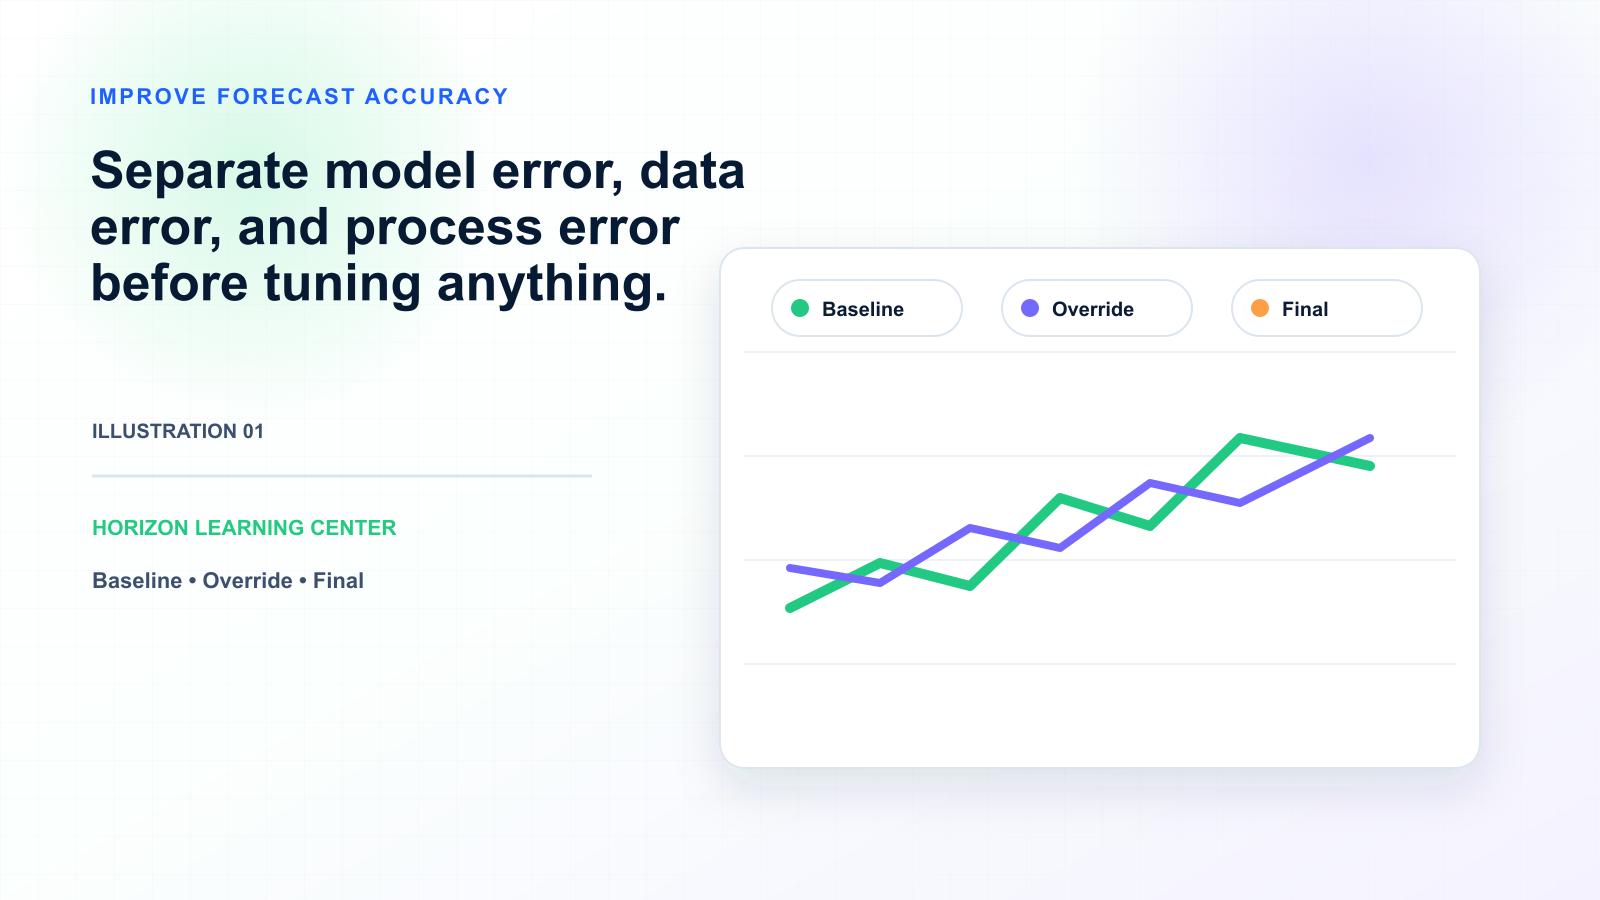
Horizon supports accuracy improvement through: ensemble forecasting with automatic per-SKU model selection across statistical and ML methods, integrated FVA tracking with structured overlay capture, data quality diagnostics surfacing common issues, separate baseline and promotional forecasting capability, NPI and EOL forecasting methods, accuracy tracking at multiple aggregation levels with horizon-specific analysis.
The honest qualifier: platforms enable improvement; they don't deliver it without methodological work. Companies expecting platform investment to improve accuracy without addressing data quality, overlay discipline, and lifecycle management typically get smaller gains than companies investing in both platform and practice. Horizon makes the practice easier, not unnecessary.
Forecast accuracy improvement delivers multiple operational benefits. Better safety stock decisions (improvement in accuracy translates to safety stock reduction at same service levels). Better capacity decisions (less buffer needed for forecast error). Better supplier relationships (fewer rush orders, fewer cancellations, more accurate commitments). Better financial planning (volume forecasts feed revenue forecasts).
The compounding effect: 5 percentage points of MAPE improvement typically delivers 10-15% safety stock reduction. Both improvements flow to working capital, service, and P&L. Even modest accuracy gains compound to substantial financial benefit.
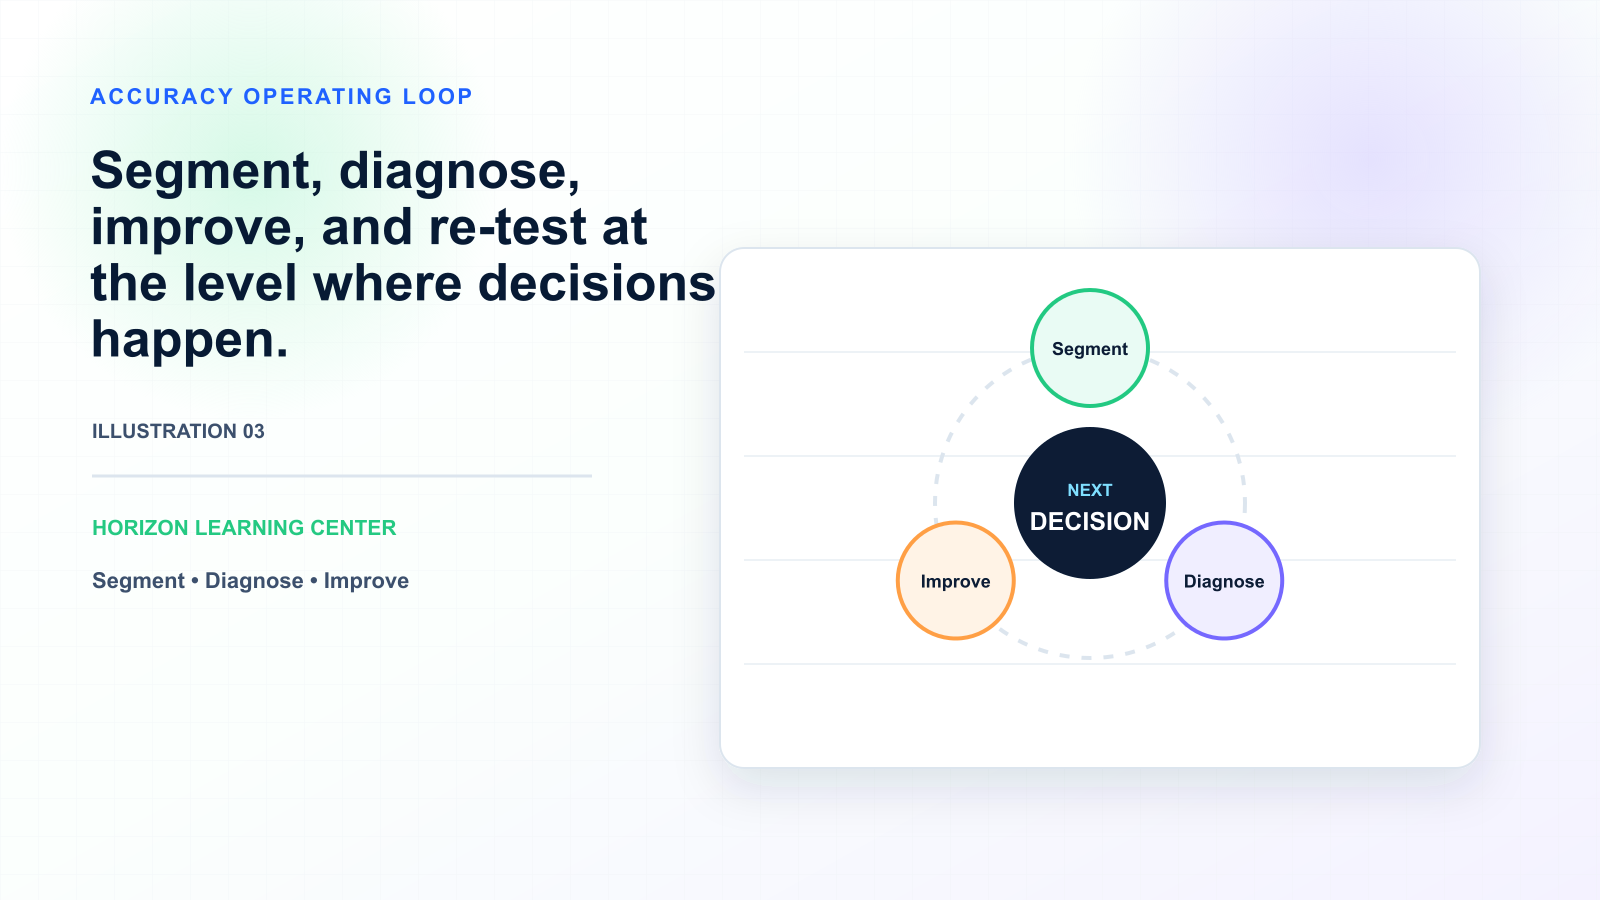
Before improvement, measure baseline accuracy properly. Standard metrics: MAPE (Mean Absolute Percentage Error) for general accuracy, WMAPE (weighted by volume) for portfolios with skewed value distribution, MAD (Mean Absolute Deviation) for value-weighted accuracy, RMSE (Root Mean Square Error) when penalizing large errors more heavily. Track accuracy at multiple aggregation levels: total company, product family, SKU class, individual SKU, by forecast horizon, by planner.
The aggregation level matters: total-company accuracy can look acceptable while individual SKU accuracy is poor (errors offsetting), or vice versa. Track accuracy where decisions get made — typically SKU-location-time-period level.
The single most under-discussed factor in forecast accuracy: data quality. Platforms can only forecast what data shows. Common data quality issues that limit accuracy: missing or inconsistent sales history, master data attribute issues (wrong product hierarchies, missing seasonal flags, incorrect customer segmentation), integration issues between source systems and planning platform (records dropping, transformations corrupting data), lack of structured promotional history tagging, inconsistent SKU lifecycle management (new product introductions, end-of-life transitions).
Before investing in better forecasting methods, audit data quality. Companies with messy data extract limited value from sophisticated methods. Companies with clean data sometimes get good accuracy from basic methods. The data quality work is unglamorous but high-leverage.
Different SKUs have different demand patterns requiring different forecasting methods. Forcing a single method onto a portfolio with diverse patterns systematically under-forecasts some SKUs and over-forecasts others. Ensemble forecasting (combining multiple statistical and ML methods) with automatic per-SKU model selection picks the right method for each SKU's pattern.
The improvement: typically 2-5 percentage points MAPE over single-method baselines, larger for portfolios with diverse patterns. Modern platforms (Horizon, Logility, RELEX, Kinaxis, o9, SAP IBP) include ensemble capability. The differentiation is in implementation depth — how many methods, how automatic the selection, how transparent the model choices to planners.
Promotional and event-driven demand typically has structurally different patterns than baseline demand. Forecasting them together (mixing promotional periods with baseline periods in statistical models) typically degrades accuracy in both. Separating them — modeling baseline demand and adding structured promotional uplift — typically improves accuracy.
The approach: structured promotional history tagging in source data, separate baseline and promotional forecasting, attribution of promotional results back to specific causal factors (price, display, advertising, customer-specific promotion). Companies investing in promotional planning discipline typically see meaningful accuracy improvement on promoted SKUs.
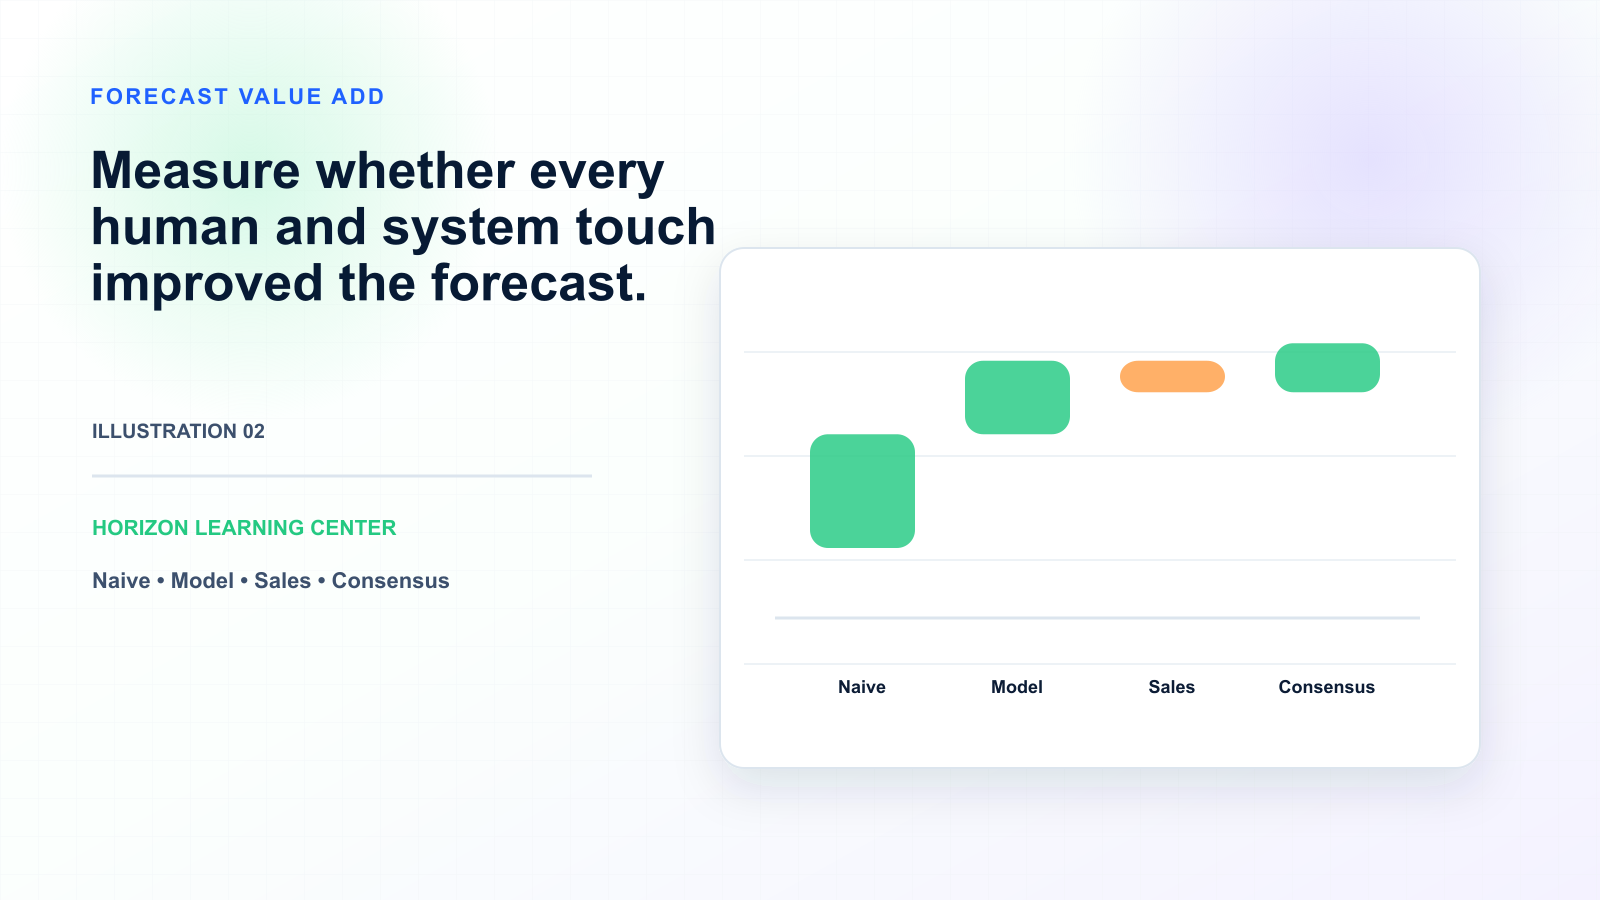
Forecast Value Added (FVA) measures whether each step in the forecasting process adds or subtracts accuracy. Common finding: planner overlays add accuracy for some patterns and subtract accuracy for others. Structured overlay practice (reason codes, expected impact documentation, duration setting, outcome tracking) makes overlay practice more disciplined and improves the value-added component.
The improvement varies by current overlay practice. Companies with extensive free-form overlay practice typically see 2-4 percentage points MAPE improvement from FVA discipline. Companies with limited overlay don't see much improvement from FVA itself but benefit from the broader discipline.
SKU lifecycle transitions are forecasting weak spots. New product introductions (no history to forecast from), product end-of-life (declining demand patterns), and product substitutions (one SKU replacing another) all systematically under-perform in standard forecasting approaches. The fix: structured NPI forecasting (analog-based methods, judgment frameworks, expected lifecycle curves), structured EOL forecasting (decline curves, transition planning), and substitution-aware forecasting (cannibalization modeling).
Companies sometimes optimize forecast accuracy at horizons that don't match decision horizons. If supply lead times are 4 weeks, optimizing 1-week forecasts doesn't help — the relevant accuracy is at 4-week horizon. The diagnostic: at what horizons do operational decisions get made? Optimize forecast accuracy at those horizons specifically. Forecast accuracy at irrelevant horizons (too long or too short) wastes analytical effort.
Forecast accuracy isn't a one-time improvement — it requires ongoing monitoring and adjustment. Establish regular review of accuracy by category, identification of accuracy degradation patterns, root cause analysis for declining accuracy, structured response (model re-selection, data quality fixes, overlay discipline). Accuracy that improves and then declines back to baseline is common when monitoring discipline lapses.