Forecast bias — systematic over- or under-forecasting — costs companies real money through inventory waste, service failures, and capacity misallocation. Unlike forecast accuracy issues from random error (which is inherently limited by demand variability), bias is structural and can be reduced through disciplined practice. The honest message: most companies have more bias than they realize, and most of it traces to behavioral patterns rather than algorithmic limitations.
This guide covers practical approaches to identifying bias, understanding why it happens, and reducing it through better forecasting practice. The techniques work regardless of platform — they're methodology, not vendor-specific features.
Horizon supports bias reduction through several capabilities: ensemble forecasting with automatic per-SKU model selection (addresses algorithmic bias), embedded FVA tracking with structured overlay capture (reveals where overlays add or subtract value), bias metrics calculated across multiple aggregation levels (makes bias visible at the level where it occurs), and structured overlay workflows that capture reason codes, expected impact, and overlay outcomes (addresses behavioral bias through discipline).
The honest framing: platforms support bias reduction but don't deliver it. The organizational work — implementing FVA discipline, structuring overlay practice, addressing process bias through governance — is the real source of improvement. Horizon makes this work easier, not unnecessary.
Forecast accuracy measures total deviation from actuals (MAPE, WMAPE, MAD, RMSE). Bias measures the direction of that deviation — are you systematically forecasting too high (positive bias) or too low (negative bias)? Total accuracy can look fine while bias is significant: forecasts that are 10% high half the time and 10% low half the time have decent accuracy but no bias; forecasts that are 5% high consistently have better accuracy but worse bias.
Bias matters operationally because it doesn't average out. Consistent over-forecasting builds excess inventory that ages and gets written off. Consistent under-forecasting causes service failures that damage customer relationships. Both are costly even when total forecast accuracy looks acceptable.
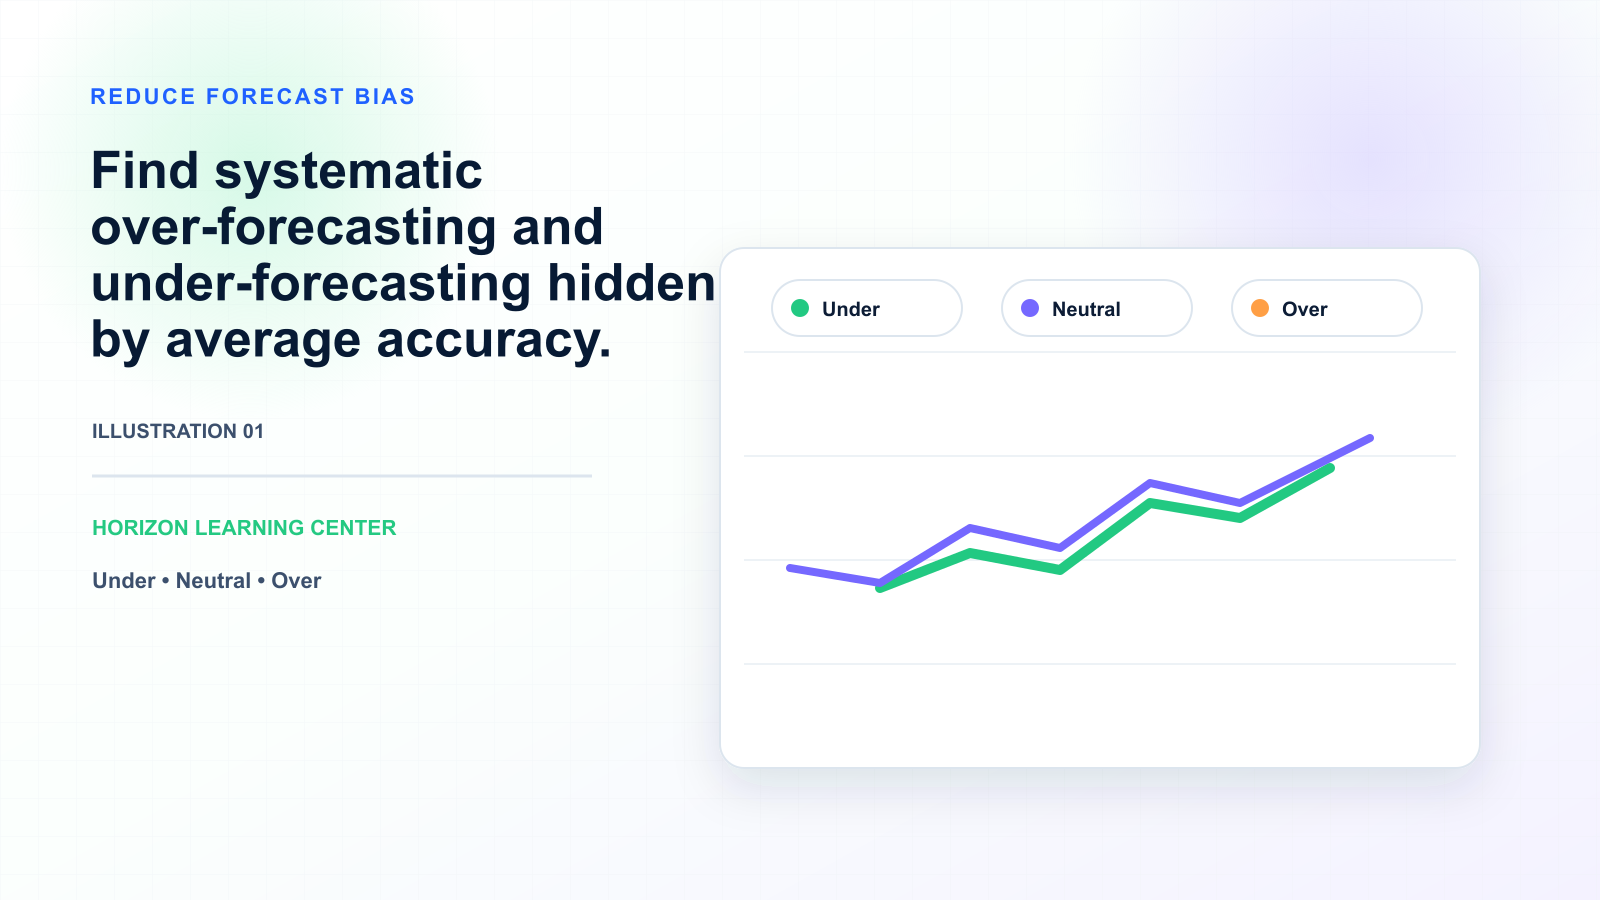
The first step is making bias visible. Standard bias metrics: forecast bias (sum of forecast minus actual, divided by sum of actual, expressed as percentage) and tracking signal (cumulative bias over time, with thresholds indicating systematic patterns). Track bias at multiple aggregation levels: total company, by product family, by SKU class, by customer, by planner, by forecast horizon. The aggregation that reveals bias varies by company — some companies show no total-company bias but significant per-product-family bias; others show no per-SKU bias but consistent positive bias on annual planning horizons.
Most planning platforms calculate bias metrics natively. If your platform doesn't, calculate manually in Excel until you fix the visibility gap. Bias you can't see can't be fixed.
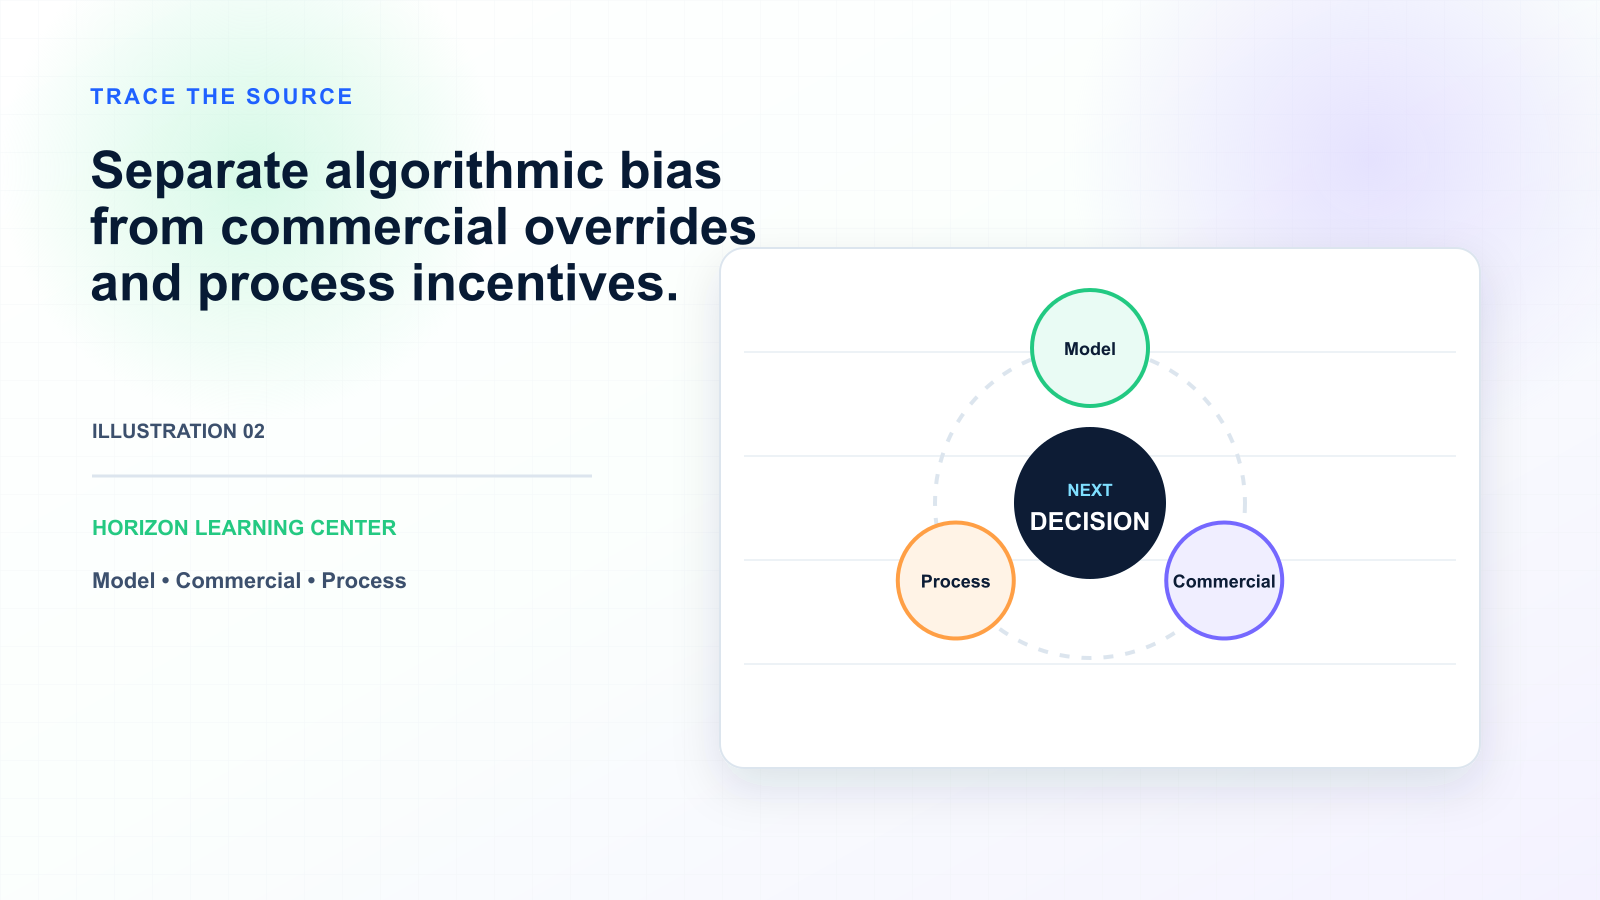
Bias sources cluster into categories. Algorithmic bias: certain statistical or ML methods systematically over- or under-forecast certain demand patterns. Less common than people think, but worth checking. Per-SKU model selection (ensemble forecasting with automatic model choice) typically addresses this.
Behavioral bias: planners systematically overlay forecasts in one direction. Common patterns: optimistic overlay before promotional periods, pessimistic overlay after recent stockouts, optimistic overlay around new product launches, pessimistic overlay during recessions or supply disruptions. Behavioral bias is where most company bias comes from.
Process bias: organizational pressures push forecasts in specific directions. Sales pressure for optimistic forecasts to justify capacity investment. Finance pressure for conservative forecasts to manage expectations. Executive pressure to "hit the number" affecting overlay choices. Process bias is often the largest source but the hardest to address because it requires organizational change.
Forecast Value Added (FVA) measures whether each step in the forecasting process (statistical baseline, ML overlay, planner adjustment, S&OP consensus, executive override) adds accuracy or adds noise. The standard analysis: compare accuracy at each step to the baseline accuracy of the statistical or ML forecast. Steps that add accuracy (positive FVA) are valuable. Steps that add noise (negative FVA) are subtracting value.
The common finding: planner overlays add positive FVA for some SKUs and patterns and negative FVA for others. The discipline becomes selectively overlaying only where overlays add value. This typically reduces overall bias because the SKUs where planners add noise are often the same SKUs where behavioral bias is strongest.
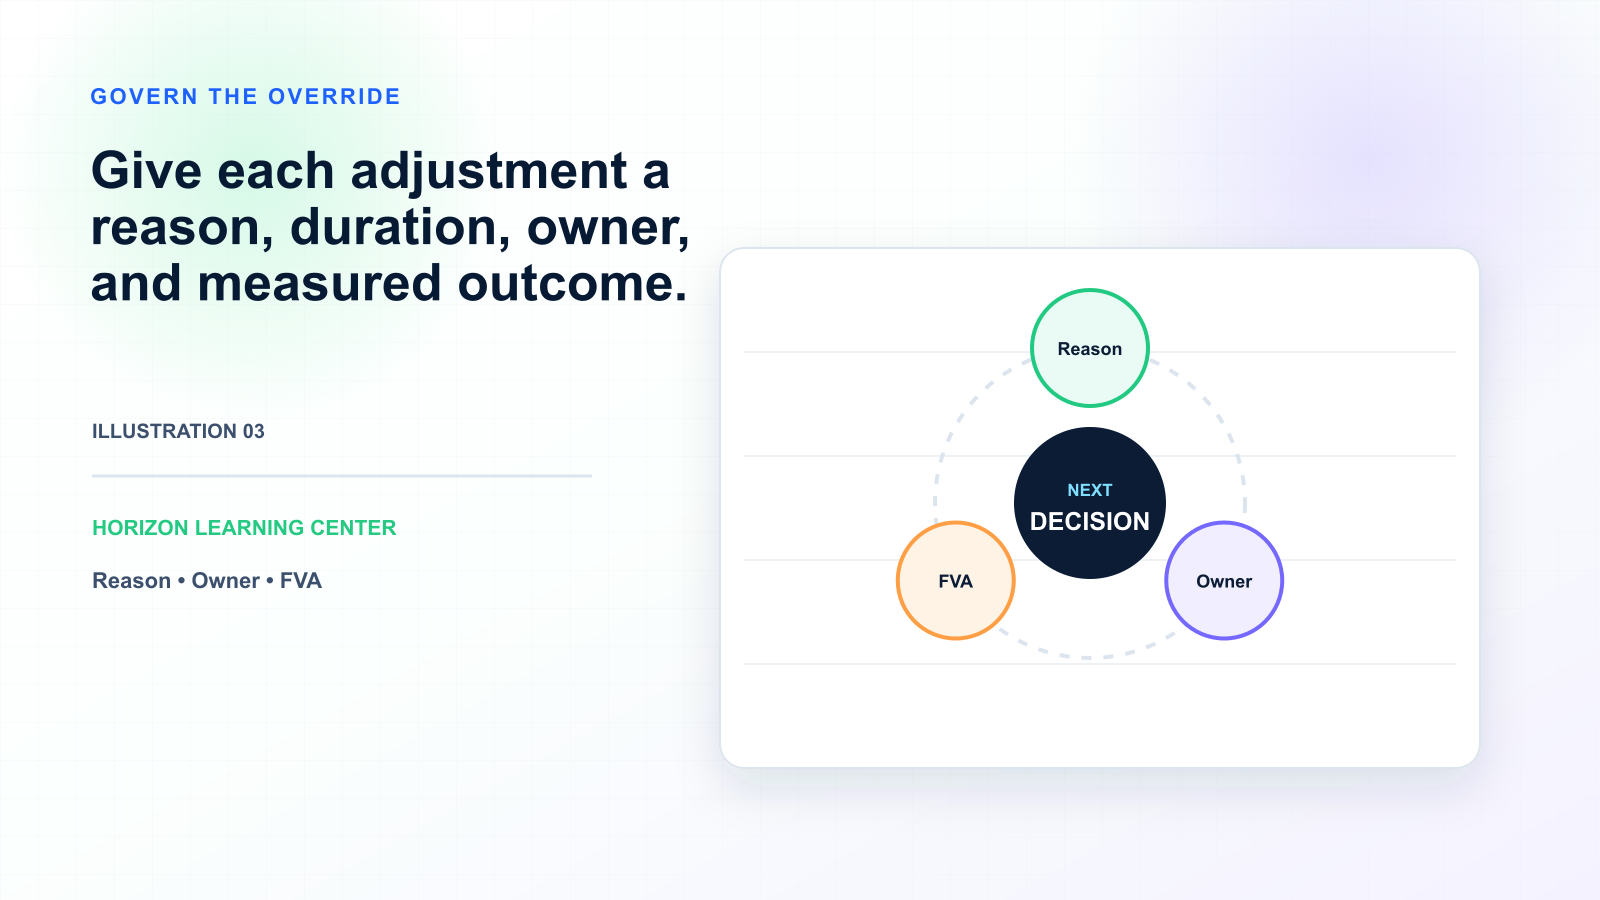
Rather than allowing free-form overlays, structure them. Require planners to: categorize the reason for each overlay (promotional, customer-specific, market intelligence, new product), document the expected impact (amount and timing), set the duration of the overlay (with automatic expiration), and track overlay outcomes against pre-overlay baseline. This discipline alone typically reduces behavioral bias substantially because the act of documentation makes planners more deliberate about when to overlay.
Process bias requires organizational solutions. Approaches: separate forecast process from financial commitment process (the forecast is an estimate; the financial commitment is a decision), establish norms that "missing forecast" is information, not failure, build culture that distinguishes between "we forecasted wrong" (acceptable if the process was sound) and "we let the forecast become a self-fulfilling prophecy" (problematic). The governance work is harder than algorithmic improvements but typically delivers larger bias reduction.
For the algorithmic bias component, ensemble forecasting with automatic per-SKU model selection helps. Different demand patterns have different bias profiles in different statistical and ML methods. Per-SKU model selection picks the method with the lowest bias for each SKU's pattern, reducing algorithmic bias. The reason this matters: forcing a single method (e.g., pure ML, pure exponential smoothing) onto a portfolio with diverse patterns produces systematic bias in the SKUs where that method doesn't fit.