Most mid-market manufacturers and distributors size safety stock using simplified formulas — often Excel-based, often deterministic, often based on assumptions that don't match operational reality. The result: safety stock that's systematically too high for some SKUs and too low for others, with both over-investment in inventory and service failures occurring simultaneously.
Right-sizing safety stock requires methodology that matches the actual demand and supply variability patterns. The math is more sophisticated than common formulas but not impractical — modern platforms include it natively, and even Excel-based implementations can do better than typical practice.
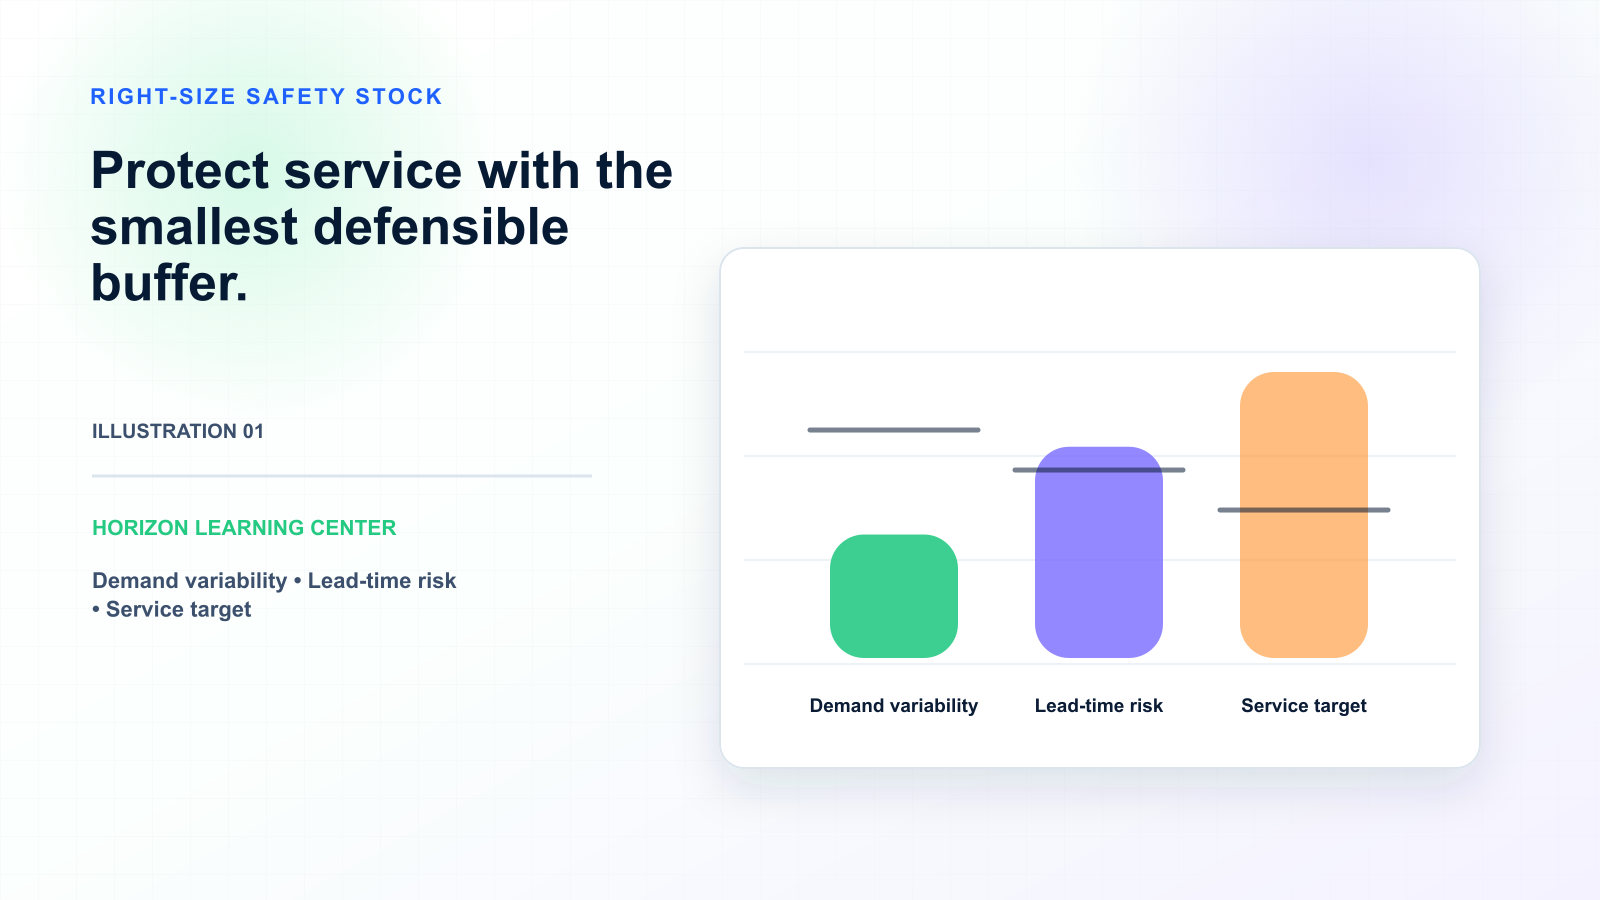
Horizon supports safety stock right-sizing through: stochastic methods handling non-normal demand distributions and lead time variability, probabilistic methods specifically for intermittent demand SKUs, segmented service levels by SKU class, customer, location, and lifecycle phase, demand-supply correlation modeling, lead time variability tracking from supplier performance data flowing into safety stock calculations, MEIO that positions safety stock at the right network level.
The honest qualifier: safety stock right-sizing is methodology more than platform. Companies running stochastic methods in Excel can do better than companies using deterministic methods in sophisticated platforms. The platform makes the work easier and more sustainable but doesn't substitute for the methodological work. Horizon supports the methodology; the right-sizing comes from applying it correctly.

Wrong-sized safety stock costs in two directions simultaneously. Over-sized safety stock (most common pattern): excess working capital, carrying cost (storage, insurance, obsolescence), reduced capital availability for growth. Under-sized safety stock: service failures, lost sales, damaged customer relationships, expensive expediting. Most companies have both problems on different SKUs — some over-stocked, others under-stocked, average looking acceptable while detailed picture is messy.
Right-sizing means each SKU has appropriate safety stock for its specific demand variability, lead time variability, and service level needs. The methodology delivers both working capital reduction (cutting over-stocked items) and service improvement (raising under-stocked items).
Typical safety stock formula: Safety Stock = Z × σ × √L where Z is a service level factor, σ is demand variability, L is lead time. This formula assumes: demand follows a normal distribution (often wrong — many demand patterns are skewed or intermittent), lead time is constant (often wrong — lead time variability is often significant), demand and lead time are independent (often wrong — they correlate in many supply chains). When assumptions are wrong, the formula systematically under- or over-sizes.
Stochastic methods replace the normal-distribution assumption with actual demand distribution shapes. Methods include: empirical distribution fitting (use actual demand history to define distribution), gamma distribution or lognormal for right-skewed demand, mixed distributions for promotional vs baseline patterns, intermittent demand methods (Croston, Syntetos-Boylan-Approximation) for slow-moving items with sporadic demand.
The improvement: typically 10-25% safety stock reduction at the same service levels by removing over-provisioning that came from assuming normal distribution when actual distribution was different. Modern platforms (Horizon, ToolsGroup, Logility, RELEX, SAP IBP) include stochastic methods. Excel implementations can do this but require more effort.
Real lead times vary — supplier performance fluctuates, transportation has variability, manufacturing has its own variability. Treating lead time as constant systematically under-provisions safety stock for variable lead time SKUs. The fix: stochastic methods that incorporate lead time variability alongside demand variability. The math: safety stock = f(demand variability, lead time variability, demand-lead time correlation, service level target, demand distribution shape) rather than the simplified Z × σ × √L.
The operational implication: SKUs with high lead time variability need more safety stock than SKUs with similar demand variability but stable lead times. Standard formulas miss this distinction.
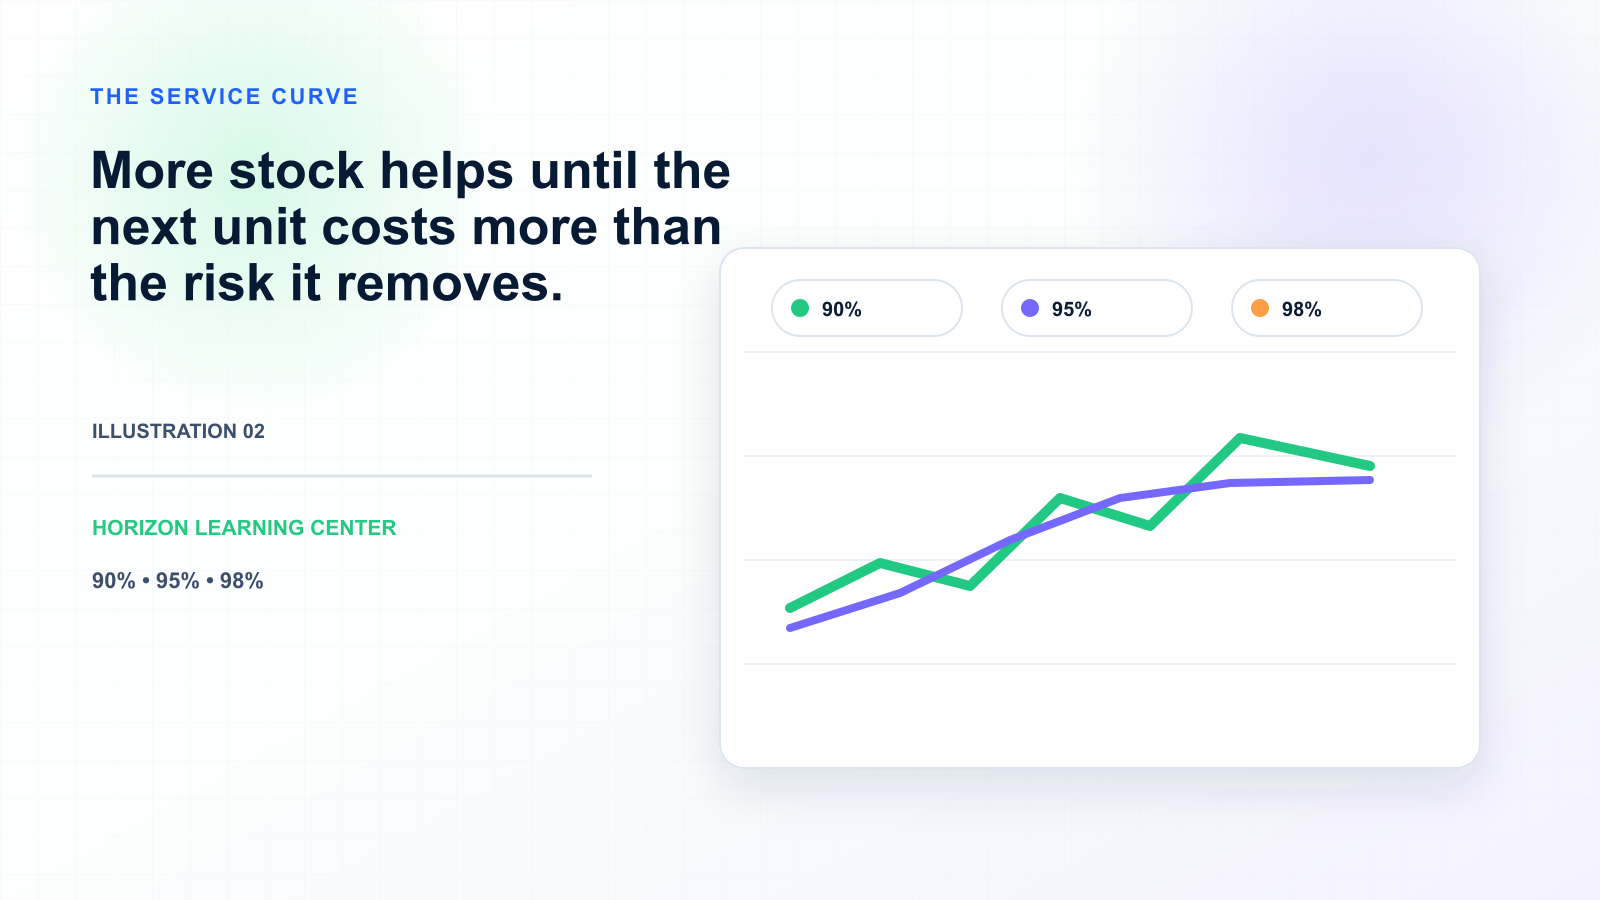
One-size-fits-all service levels (e.g., 95% for all SKUs) systematically over-provision low-value SKUs and may under-provision high-value SKUs. Segmented service levels by SKU class: A-class (top 20% by revenue or criticality) at 98-99%, B-class at 94-96%, C-class at 88-92%. The reallocation reduces total inventory while improving service where it matters most.
The segmentation can also vary by customer (A-customer SKUs at higher service than C-customer SKUs), by location (primary DC vs satellite locations), by lifecycle phase (new products at higher service to build market presence, end-of-life products at lower service). Segmentation depth depends on company complexity.
Slow-moving SKUs with intermittent demand patterns (long gaps with occasional orders) don't fit standard safety stock approaches. Statistical safety stock methods assume regular demand patterns. The fix: probabilistic methods specifically for intermittent demand (Croston's method, Syntetos-Boylan-Approximation, or Bayesian approaches). These methods handle the gap-and-order pattern realistically.
Typical impact: 30-50% safety stock reduction on slow-moving SKUs while maintaining service levels. Companies with significant slow-moving inventory (aftermarket parts, specialty SKUs, long-tail portfolios) see substantial working capital release from this change.
Standard formulas assume demand and lead time are independent. In practice, they often correlate: when industry demand surges, supplier lead times typically extend (suppliers can't keep up); when demand drops, lead times often shorten (suppliers eager for orders). Standard formulas using independence assumption miss this correlation, typically under-provisioning during demand surge periods.
Sophisticated methods handle this correlation explicitly. Modern platforms include this capability; Excel implementations rarely capture it.
Safety stock isn't a one-time calculation — it needs ongoing review. Demand patterns change, lead times shift, service requirements evolve. Establish review cadence: quarterly review of SKU classification and service level segmentation, monthly review of significant variance from expected safety stock, exception-based review when patterns shift significantly (new customer, lost customer, supplier change, lifecycle transition). Safety stock that's right today may not be right in 6 months if conditions change.