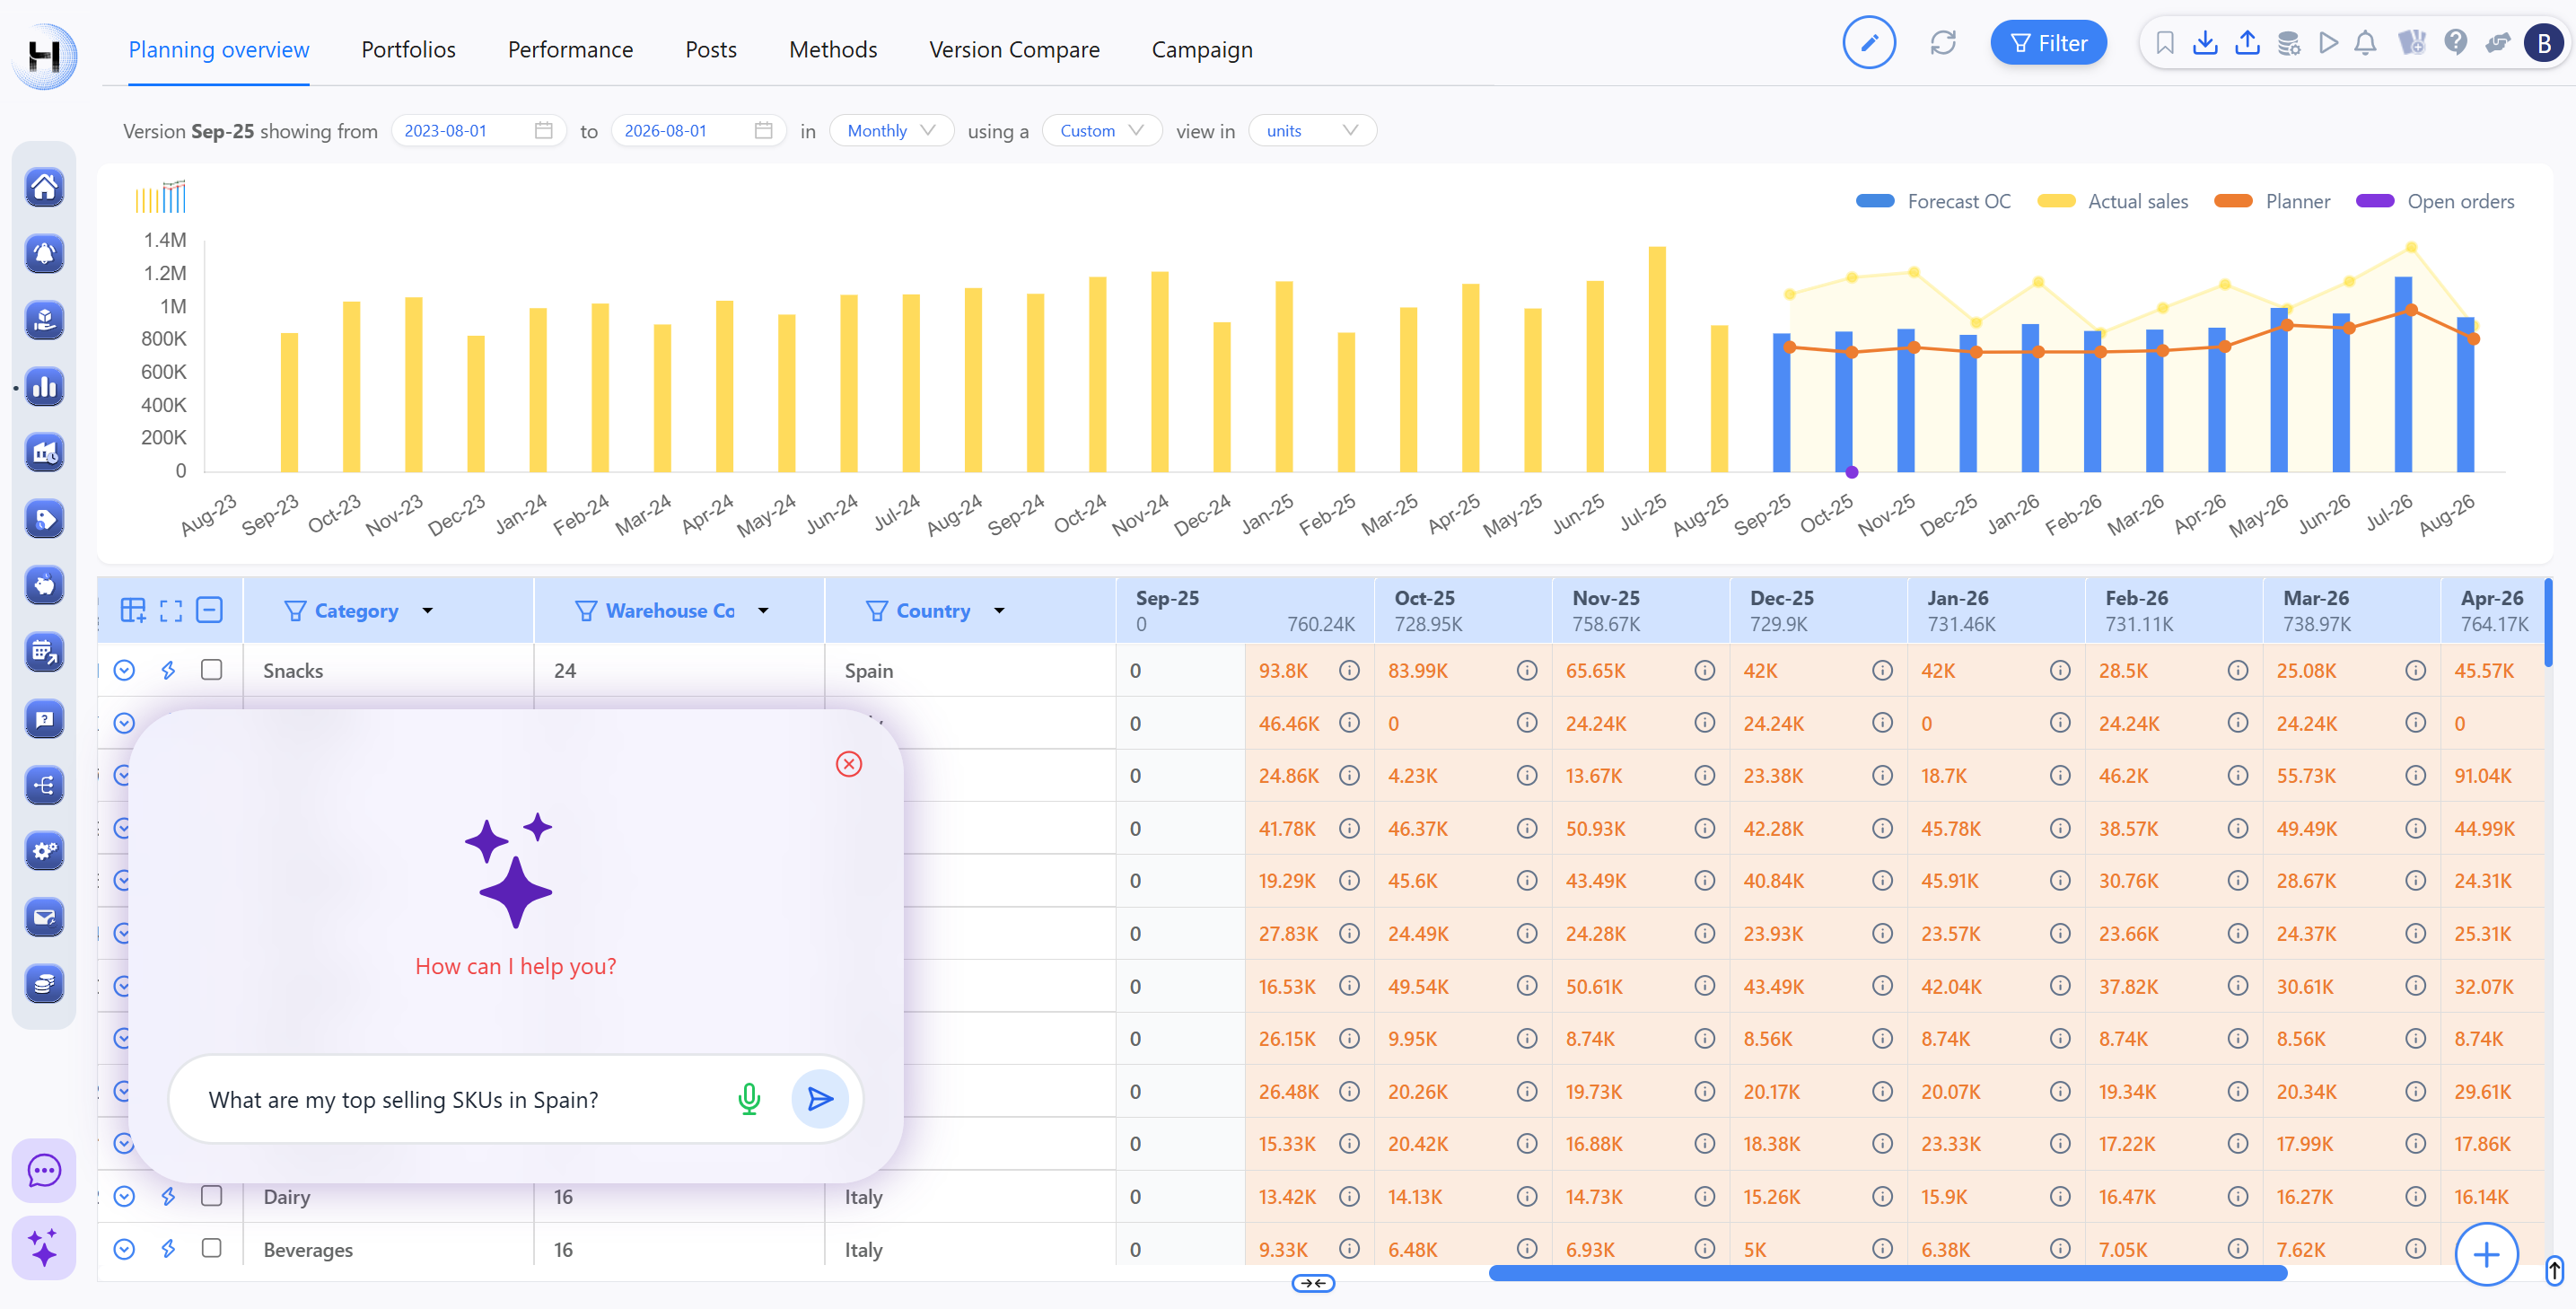
What is Demand Planning?
.png)
You're trying to figure out how many products to make next quarter. Make too little, and you lose sales, customers go to competitors, and your revenue target gets missed. Make too much, and millions of dollars sit idle in warehouses collecting dust while your cash flow evaporates.
Then there are compounding problems. Overstocking one quarter creates inventory carrying costs that eat into margins. Stockouts damage customer relationships and take months to rebuild. Get it wrong consistently, and you're either bleeding money or constantly fighting firing on the production floor.
This balancing act demands careful planning. Done right, it's the difference between a lean, responsive supply chain and one that ties up capital, misses deadlines, and frustrates everyone involved.
In this guide, you'll learn what demand planning actually involves, why it matters more than you might think, and how to approach it without getting lost in buzzwords.
What is demand planning, really?
Demand planning is the process of predicting how many products your customers will want and when they will want them.
But the prediction is only half of the story. The real work is translating that forecast into a plan that works, one that accounts for seasonality, promotions, supply constraints, and all the chaos that happens in the real world. Then you refine that plan through cross-functional collaboration, based on what sales knows, what marketing is planning, and what operations can deliver.
Here's why this matters: every decision downstream depends on your demand forecast. How much raw materials should you order?
When should you schedule production?
How many people should you staff?
How much inventory should you hold at each warehouse?
What would be your cash flow?
Improve forecast accuracy by even 10–15%, and you can free up millions in working capital, reduce excess inventory, and drive higher revenue.
The two core activities of demand planning
Demand planning breaks down into two main steps, each with its own challenges.
1. Baseline generation: Building your forecast foundation
This is where you take historical data and build a foundational forecast. You're looking for patterns, seasonality, trends, and baseline demand levels for each product.
You might start simply: just averaging last year's sales for the same period. But as you get more sophisticated, you add statistical methods that automatically detect seasonality, trends, and irregularities. Eventually, some companies deploy machine learning models that process massive datasets and detect patterns humans would never spot.
The goal is to establish what "normal" demand looks like for each product. For a winter heating product, you might see demand spike 300% from October through February. For a summer beach item, demand might be nearly flat except in July and August. For an industrial widget with stable B2B customers, demand might be remarkably consistent month after month.
Your baseline forecast captures these patterns. It's not perfect; it can't predict unexpected events, but it gives you a starting point grounded in historical reality.
2. Adjustments: accounting for known changes
Once you have your baseline, you adjust it based on things you know are coming.
Sales knows about three major promotional campaigns planned for next quarter. Marketing is launching a new product that cannibalizes some existing product sales. A major customer just told you about a 20% order increase. Your supply chain team flagged that a key component has a 16-week lead time due to supplier constraints.
These are the inputs that transform a statistical forecast into a business plan.
Early-stage companies might handle this informally; sales and operations just email the planner when something big is coming. More mature organizations have structured monthly meetings where sales, marketing, finance, and supply chain teams all provide formal input.
Why demand planning matters: the numbers
The financial impact of better demand planning is substantial.
McKinsey's research found that a 10-20% improvement in forecast accuracy translates to:
- 5% reduction in inventory costs
- 2-3% increase in revenue
The Institute of Business Forecasting estimates that a 15% improvement in forecast accuracy delivers a 3% or higher improvement in pre-tax earnings.
For a company with $500 million in revenue and a 10% net margin, a 3% earnings improvement could mean an extra $1.5 million on the bottom line.
Poor forecast accuracy (MAPE > 25%): You're constantly caught off-guard. You either maintain high safety stock (tying up capital) or accept frequent stockouts (losing sales). Cost of goods sold increases because you're paying expedite premiums, and your customer service metrics suffer.
Good forecast accuracy (MAPE 10-15%): You're working with reasonable safety stock levels. You can plan production runs efficiently. Your procurement team can negotiate better supplier deals because they're not constantly asking for urgent deliveries.
Excellent forecast accuracy (MAPE < 10%): You're running a lean operation. You hold minimal safety stock because you trust your forecast. Demand variability causes minimal disruption to your supply planning. This is where world-class companies competing not just on product quality but also on supply chain efficiency.
Different types of demand you'll encounter
Not all demand behaves the same way.
Regular demand is stable and predictable. For example, an industrial manufacturer may sell bolts to the same factory month after month.
Seasonal demand fluctuates predictably based on time of year. Heating fuel in winter, ice cream in summer, and holiday decorations in November and December. These patterns repeat, so they're learnable from historical data.
Intermittent demand is irregular and sporadic, with frequent periods of zero demand. Replacement parts for specific equipment. Harder to forecast because you have fewer data points.
Lumpy demand has high variability and irregular patterns, such as B2B industrial orders that vary wildly.
Event-driven demand spikes temporarily due to specific triggers, such as a competitor facing stockouts, a price promotion, or viral social media attention.
The challenge is that most companies have a mix of all these demand types across their product portfolio. Different SKUs behave differently. This is why one-size-fits-all forecasting approaches fail.
Better demand planning recognizes these differences and applies appropriate methods to each. Regular demand gets simple statistical models. Seasonal demand needs methods that explicitly model seasonality. Intermittent demand may require specialized forecasting methods, machine learning, or exception-based management rather than traditional forecasting.
Common misconceptions about demand planning
Misconception 1: "Better demand planning means 100% forecast accuracy."
This is impossible and would mean you've somehow achieved perfect information about the future. The goal isn’t perfect forecasts; it's accurate enough that you can make good decisions. Often that means MAPE in the 10-15% range, which is genuinely excellent.
Misconception 2: "Demand planning is just about forecasting numbers."
The numbers are only half of it. The real value comes from the process: getting different departments to align on what they expect, identifying potential issues early, and making coordinated decisions based on shared understanding.
Misconception 3: "Sales should own demand planning."
Sales teams have incentives that can bias their forecasts upward. It's better to have an independent planning function that considers sales input while also looking at historical patterns and market reality.
Misconception 4: "Once you build a forecast, you're done."
Forecasts decay. Last month’s forecast may become outdated as new information arrives.
Key Takeaways
- Demand planning predicts customer demand and translates that prediction into an actionable supply chain plan that accounts for promotions, constraints, and reality.
- There are two main activities: building a statistical baseline (using historical data and trend analysis) and adjusting it based on known business events (promotions, contracts, supply constraints).
- The financial stakes are real. A 10-20% improvement in forecast accuracy can deliver millions in bottom-line profit through reduced inventory, fewer stockouts, and smoother operations.
- Different demand patterns require different approaches. Regular demand, seasonal demand, intermittent demand, and lumpy demand need different forecasting methods and planning strategies.
- Demand planning is a process, not just a number. The value comes from cross-functional collaboration, continuous improvement, and making coordinated decisions based on shared understanding.
- Maturity matters. Companies evolve from simple historical averaging to sophisticated machine learning and AI-driven planning.
Related Concepts
Sales forecasting vs. demand planning: Sales forecasting focuses on revenue and customer pipeline. Demand planning goes deeper; it looks at historical patterns, seasonality, and actual product-level requirements. Demand planning often challenges and refines the sales forecast.
Supply Planning: Once you know what demand looks like, supply planning determines how to meet it. Can you produce enough? Do you have enough materials? This requires coordinating demand planning with production capacity and procurement.
Forecast Accuracy Metrics: These are the metrics that measure how close your forecast was to actual demand. MAPE, RMSE, and MAE all tell different stories about forecast quality. Understanding which metric to use matters.
Demand Sensing: Using real-time data (orders, point-of-sale, shipments) to refine short-term forecasts. While demand planning is about predicting what will happen, demand sensing is about adjusting quickly when what's actually happening diverges from the forecast.
S&OP (Sales & Operations Planning): This is the monthly or quarterly process where demand planning, supply planning, financial planning, and business strategy align.
Sources
Related Podcast


Related Webinar


Related Article