
Machine learning forecasting and inventory simulation: what works in practice, with Nicolas Vandeput
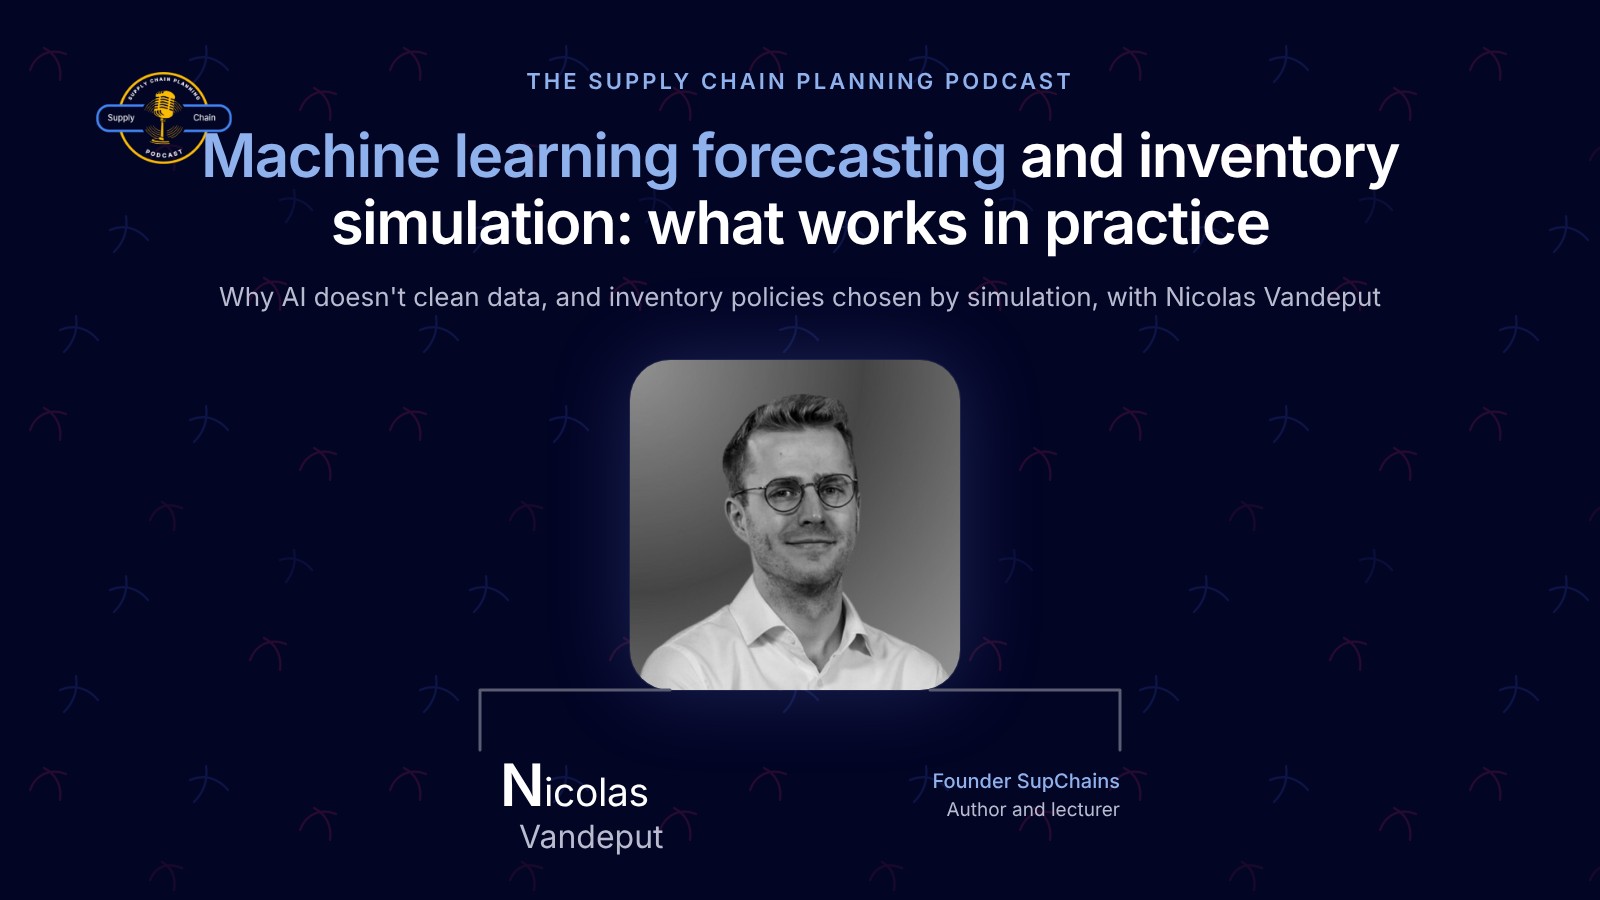
About Nicolas Vandeput
Founder of SupChains and SKU Science, author of books on data science for supply chain forecasting and inventory optimisation, university lecturer, and organiser of the VN1 forecasting competition and the first global inventory competition. Before that, inventory manager for Europe and supply chain data scientist at Bridgestone. Listen to the episode.
Machine learning is easier than you think
Nicolas Vandeput came to Python late. "When I started to learn Python in 2017, I didn't code for nearly 10 years. I'm not an IT person. So I learned everything from scratch, including machine learning. It's not that complicated." He finds Excel VBA harder.
His evidence that the bar keeps dropping is the VN1 forecasting competition he organised. "Some of the winning code was only 350 to 450 lines. If you know what you're doing and you use the right tools in Python, in 350 lines of code you can make a world-winning solution." The reason he prefers code to boxed software is that every supply chain is different, and the differences surface slowly. "If you implement some sort of frozen software, six months after that you realise that you missed a few rules, that some of your data changed. If you have the flexibility of Python, it's very easy to add that on top."
He also splits the problem in two. The forecasting model has one job, the best possible forecast, and that is where data cleaning and machine learning live. The planner's interface, where people enrich, review and check KPIs, is a separate exercise, "it could be two different pieces of software".
AI does not clean your data
Ben raised the hope that AI removes the need for data cleaning. Nicolas was blunt. "I am not aware of a single company, organisation, team who used AI to do data cleaning in the sense that AI spots errors in master data and corrects them on its own. Not a single use case in the world."
Data cleaning is his number one priority, and it means both transactional and master data. It does not mean smoothing outliers. "I'm basically opposed to that. I don't do it. I never do it. I don't advise people to do it." He has explained this at conferences, slides and all, and still been asked afterwards how he does outlier detection.
What real cleaning looks like is mundane. Point-of-sale data with July missing: "You don't need an algorithm to understand that you have 36 months of data and one of them is missing." Two per cent of transactions with a price of zero: a return, a giveaway, an inventory correction, or an error. A sales quantity of three million that turned out to be a part number pasted into the wrong column. "It's not so much the algorithm, it's more having a discussion about the business logic."
Explainability is a trade-off, and he won't take it
Wim described leaders who want to start with moving averages because they want something explainable. Nicolas sees two questions in that. On explainability: "More of it is usually better, but it comes as a trade-off. You could have a very good forecast that you cannot explain, or a poor forecast that you can explain. If your supply chain leaders are willing to say, we want explainability at the cost of a poor forecast, that's really a bad supply chain."
His argument is scale. "A supply chain is nearly a living organism that needs to take hundreds, thousands, tens of thousands of decisions daily or weekly. It cannot be you in front of your computer a thousand times a day clicking yes, no. It needs to be run mostly by algorithms, supervised by humans." Explainability, he adds, often really means storytelling, "human convincing human. A forecast is not about convincing anyone."
And a warning on labels: "As soon as you go into machine learning, you lose most explainability. If anyone says, I have machine learning and it's explainable, that's not machine learning." Models that decompose into level, trend and seasonality are statistical, exponential smoothing and ARIMA, and they make great visuals. In the VN1 competition, decomposable machine learning did not appear at all.
Skip the statistical step
On the second question, whether to go from zero to one before one to two, his answer surprised the hosts: machine learning is easier for the planner than a statistical model. Statistical models need parameters tuned and models selected, and they break on promotions, shortages, new products and short histories, all of which the planner then patches by hand. "Everything I just said, if you implement machine learning and if you do it right, you don't have a problem. It's just working." The planner can then "focus on what do I know as a human that the model is not aware of".
Does machine learning need different data? "Not really. You need clean data for both. If you give crappy data to a statistical model, it will not work." The only extra is slightly better master data: families, categories and brands properly typed.
What the planner does instead
Once the model runs, the planner's job changes. Less time selecting models and tweaking Excel, more time gathering and feeding data, promotional activity above all, and most of all looking for what the model cannot see. "They can call the clients, discuss with marketing, with sales, to get information that is not automatically fed to the model. It's a bit like you would play on the stock market, but with insider information." His rule for overrides: "If you know something, do something. But if you don't know anything special, it's best to just let it be."
Fewer planners is rarely the result. "In practice, I don't see so many companies after the project reducing the number of planners. It's just the way they work changes."
Forecasting is mature, inventory is not
The second half of the conversation turned to inventory, where Nicolas thinks the field is years behind. The reason is simple: in forecasting, you find out who was right. "If Wim says we need 10 pieces in stock, Ben says 12 and I say eight, after the fact we still don't know who was right." So inventory became a world of storytelling and impressive equations. "I was doing that maybe five years ago: if my model for inventory looks complicated mathematically, I must be right. In practice, it doesn't work better."
His fix is simulation on real data. Take the client's transactional history and historical forecasts, run policies A, B and C against them, and see which one would have hit the target with the least inventory. The catch in older simulations was the demand assumption: "As soon as you assume your demand is normally distributed, you're not trying a model against real data, you're trying it against another model." He makes no assumptions anymore.
What wins, surprisingly often, are the simple policies. "Forecast-driven policies worked really, really well. I'm going to keep three weeks of forecast for this product. It sounds super simplistic, and yet, as long as you have a good forecast, it works."
The handcrafted rule that beat the models
A client with forecasts biased 10 to 12% high asked Nicolas to optimise inventory with the bias as a given. After the simulation picked a winner, the client asked him to try their own custom safety stock formula, which ignored forecast errors in one direction. "It really looked like a formula that was handcrafted, that has no mathematical background. I was thinking, no way. So I tried it and it worked. It was the best policy. Zero theoretical foundation." It worked because of the bias. Fixing the forecast would have been better, and was out of scope.
The standard safety stock formula gets the same treatment. "Most often it's not properly applied. There's some tribal knowledge on how to do it. Even if you think you're using it, you're not using it properly." The only way to know is to test it.
Targets, not total cost
Wim asked how a manager sets targets in a world of competing policies. Nicolas starts from service: 97% fill rate on one segment, 92% on another, then finds the policy that reaches each target with the least inventory. Change the target, rerun the competition.
He deliberately avoids minimising total cost, in theory the perfect approach. "In practice, you cannot easily access all the costs in your supply chain, and you will have debate on the others. If you say a transaction cost is 50 euros and I think it's 300, I will never be able to convince you to follow my model. Now we don't have trust in the model because of the assumptions in the cost."
The only forecast benchmark that makes sense
Management targets for forecast error, Nicolas says, usually come "out of nothing", and industry benchmarks are no better: different products, markets, metrics and horizons. His alternative is free. "Compare yourself to a moving average. Run your software, run your process, and next to that track the error of a moving average. If you reduce the error by 20 to 30%, you're best in class." Seasonal, promoted, shortage-prone categories can do 30 to 40%; flat ones maybe 10%. The benchmark adapts to every market and segment on its own.
It has a second use. "I've seen many big software companies failing at beating moving averages. If you say, I know nothing, I'm going to do a moving average, you would already be beating some big software vendors."
Outside-in data: not in his top ten
Ben asked about outside-in planning with external drivers. Nicolas has done one or two projects with it and is unconvinced. "It comes with very nice storytelling, a bit like I can foretell the future. In practice, the added value is really, really low." Three problems: you cannot forecast GDP or commodity prices ("if anyone can do that, stop doing supply chain, go to the stock market"), the link between a country's quarterly GDP and one product in one week in one market is tiny, and the data is hard to get.
"If I had to make a top ten recommendation for demand planning, external drivers wouldn't be in the top ten. The top three: promotion data, shortage data, and tracking forecast value added against a moving average." The exception is a true leading indicator such as building permits for appliance sales, which you don't have to forecast. "It's a very good example, but an extreme case that most supply chains will never find."
The first inventory competition
Nicolas is running what he believes is the first global inventory competition: 599 products, six ordering rounds over three weeks, and the only thing you submit is how much you order. "It's a free-fight competition of inventory. You can do anything you want, and as long as it works, everyone will be amazed." He hopes to see DDMRP, ABC segmentation, academic models, reinforcement learning and AI agents side by side, with the caveat that one limited competition gives a direction, not a verdict. His Udemy course teaches the same method, and it is how his university class evolved: from solving the safety stock equation, to policies, to a competition between policies.
Your next steps
- Clean transactional and master data by business rule and conversation, not by smoothing outliers: missing months, zero prices, pasted-in values.
- Track a moving average next to your forecast process and measure forecast value added against it; aim for 20 to 30% less error.
- Get promotion and shortage data into the model before you think about external drivers.
- Simulate inventory policies on your real history, including simple forecast-driven ones, and let the simulation choose.
- Set service targets by segment and pick the policy that reaches them with the least inventory.
Nicolas's advice for learning the craft is to try things yourself. "What I try to do in my books is saying, here's the baseline code in Python, here's a template in Excel. Give it a go. Change it the way you want. Experimenting, for me, is key."

