

Demand planning is the process of forecasting future customer demand and turning that forecast into an aligned plan that operations, procurement, and finance can execute against. It sits at the front of the supply chain every other planning decision (inventory, production, capacity, procurement) depends on the demand plan being credible.
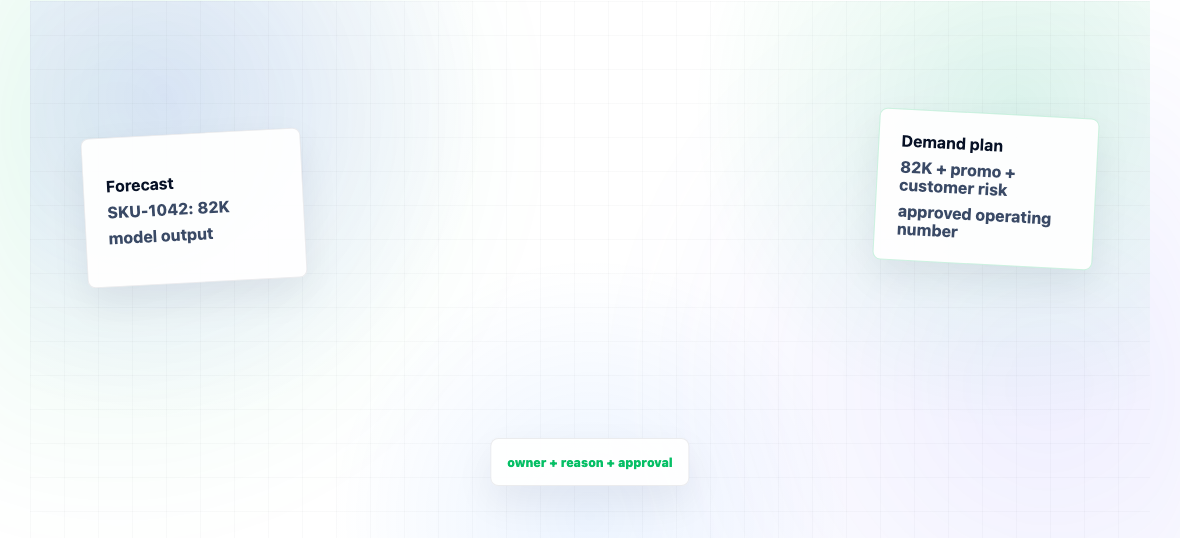
Demand planning is not the same as forecasting. Forecasting is the statistical or judgmental act of producing a number. Demand planning is the broader process: producing the forecast, reviewing it with sales and marketing, reconciling it with strategic targets, and converting it into a one-number plan that downstream teams use. A company can have excellent forecasting and weak demand planning if those reviews don't happen.
This page covers the five-step process most mature teams run, the three forecasting methods you'll encounter, and the KPIs that signal whether the process is working.
Author :
Chinmay Narwane
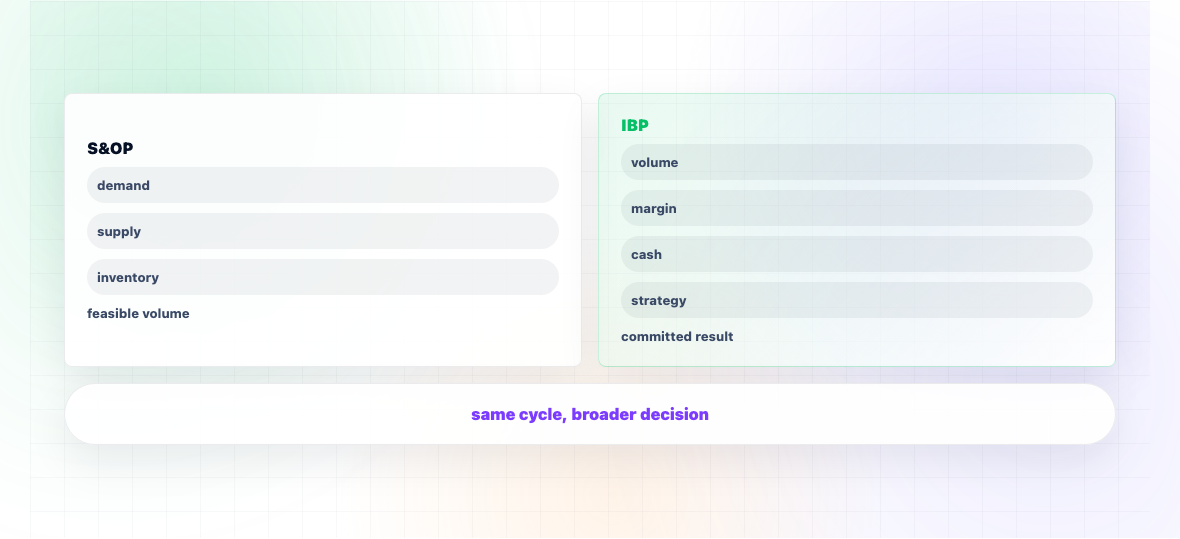
S&OP (Sales and Operations Planning) is a monthly process that balances demand and supply across a 12-24 month horizon. IBP (Integrated Business Planning) is the evolution of S&OP that adds financial reconciliation, scenario planning, and strategic alignment extending the same rhythm to cover the full P&L impact of operational decisions.
The two terms are often used interchangeably, and many "IBP" implementations are S&OP processes with a finance person added to the meeting. That is not the same thing. True IBP closes the loop between the operational plan, the financial plan, and the strategic plan, so the numbers in the boardroom match the numbers in the production schedule.
This page compares the two side-by-side on scope, participants, horizon, and outputs and explains the three signals that indicate a company is ready to move from S&OP to IBP.
Author :
Chinmay Narwane
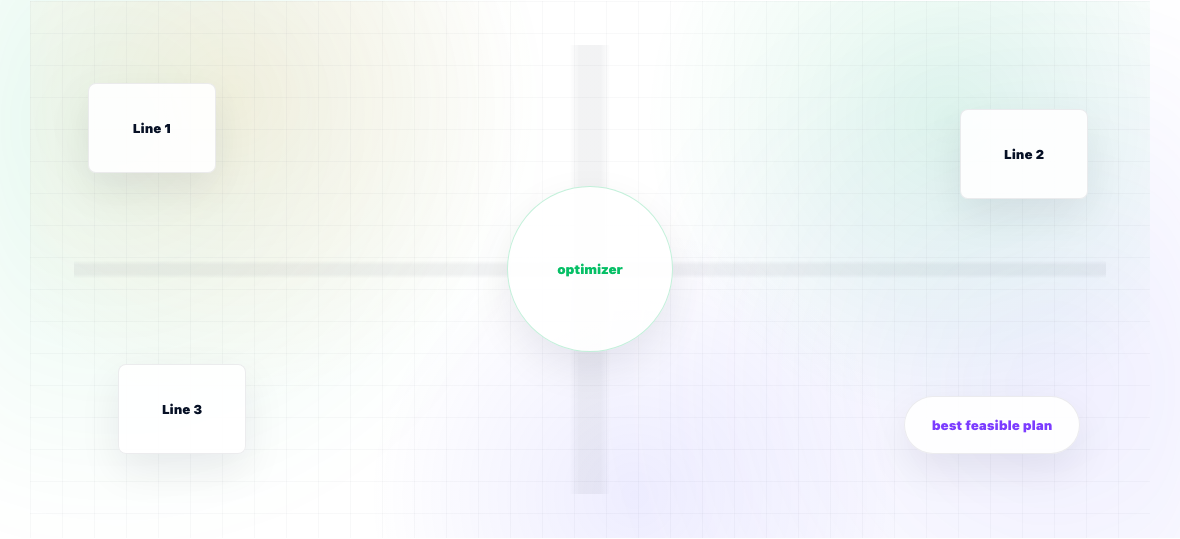
Manufacturing optimization software uses mathematical models (linear programming, mixed-integer programming, constraint solvers, and increasingly machine learning) to recommend the best production, capacity, and scheduling decisions against a defined objective usually maximum throughput, minimum cost, or maximum on-time delivery, often all three with weightings.
The category is wider than most buyers assume. It spans capacity planning (which products to make in which plant), production scheduling (which order runs on which machine in which sequence), and increasingly inventory and distribution optimization where decisions cascade into the plant floor. The common thread is that the software does not just display data it chooses a plan from millions of feasible options.
This page explains what the category covers, how it differs from ERP and MES (the two systems it is most commonly confused with), and the four capabilities to evaluate before buying.
Author :
Chinmay Narwane
Forecast accuracy is the percentage of demand a forecast got right when measured against actual sales. If a planner forecast 1,000 units and the business sold 950, the forecast was 95% accurate at the unit level. A higher percentage means a closer match, and a closer match means less safety stock, fewer stockouts, and less wasted capacity.
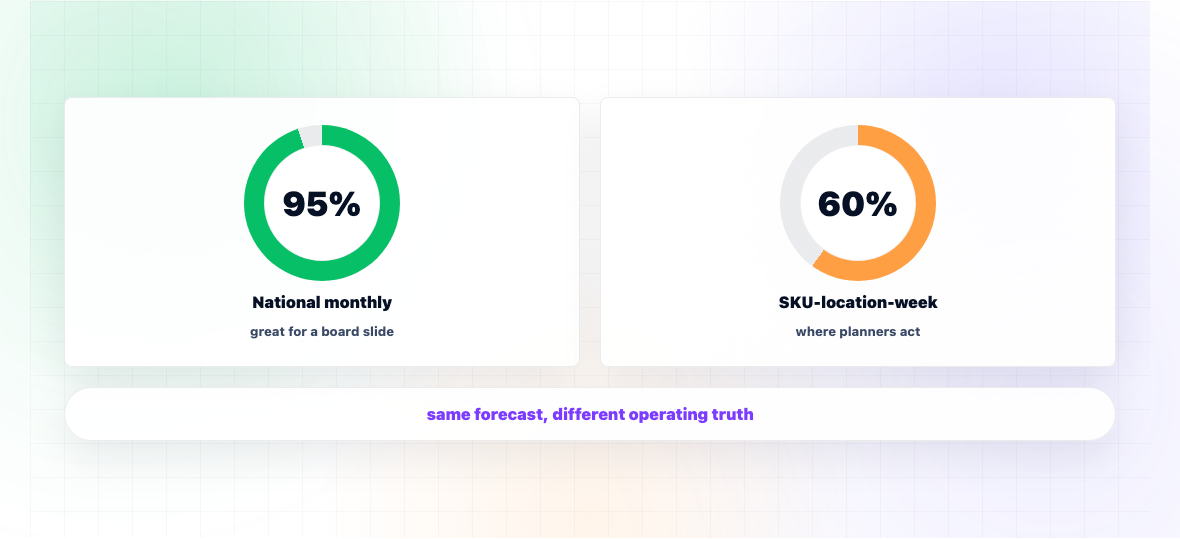
The simple-sounding definition hides a sharp question that trips up most planning teams: accurate at what level, over what time bucket, and using which formula? A forecast that looks 95% accurate at the national, monthly level can be 60% accurate at the SKU-location-weekly level where the actual replenishment decisions are made. The same dataset can produce very different "accuracy" numbers depending on the math chosen.
This page covers the four formulas planners actually use, where each one breaks down, and which one to pick depending on what decision the number will drive.
Author :
Chinmay Narwane

