

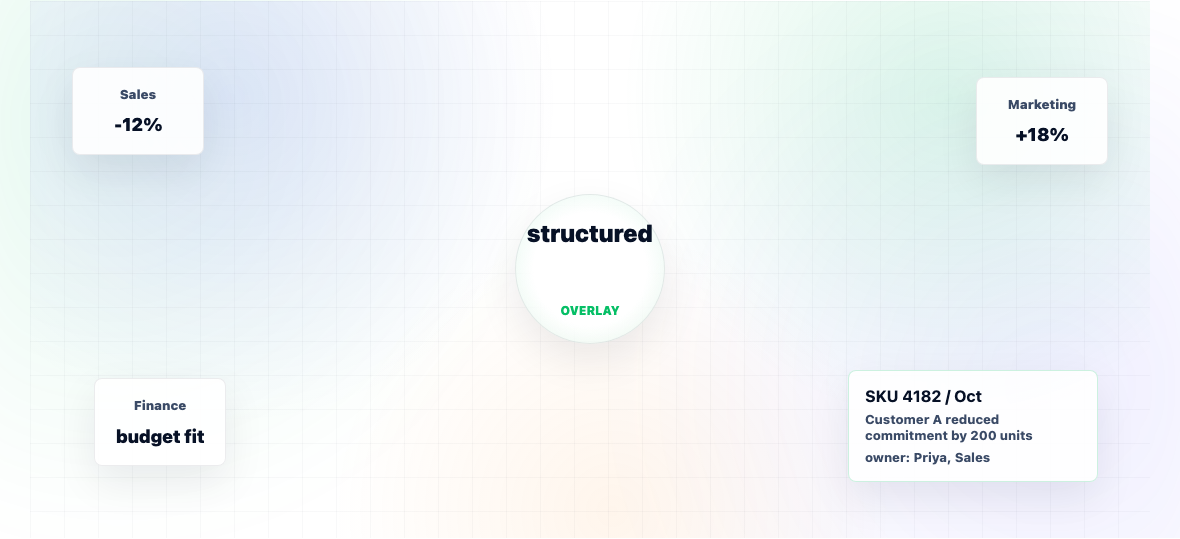
Forecast collaboration is the structured process by which sales, marketing, product, and finance contribute their domain knowledge into the demand forecast and demand planning consolidates those inputs into a single agreed number that downstream functions execute against. It's the difference between a forecast generated in isolation by a planner and a forecast that reflects what the whole organisation knows.
The word "collaboration" carries some baggage. In many companies, forecast collaboration has degenerated into a negotiation sales fights for a low forecast (to beat quota), marketing fights for a high forecast (to justify investment), finance fights for whatever matches budget. Real collaboration is not negotiation. It's the structured exchange of information so the resulting forecast is more accurate than any single contributor could produce alone.
This page explains what good forecast collaboration looks like, the common failure modes, and the discipline that makes it work.
Author :
Chinmay Narwane
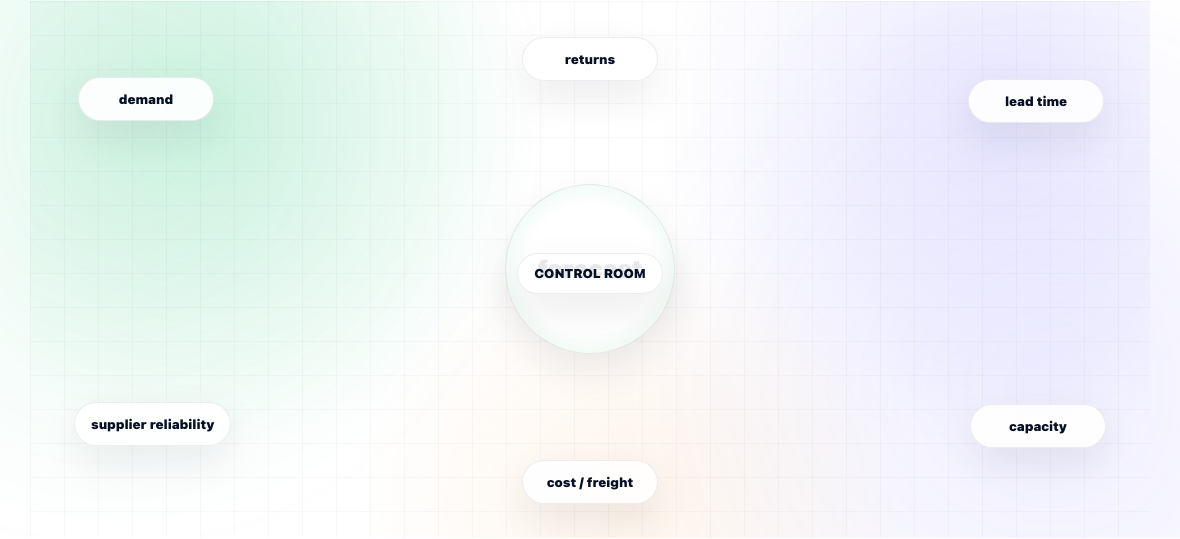
Supply chain forecasting software predicts future values across multiple supply chain dimensions customer demand, supplier lead times, transportation capacity, raw material availability, returns and feeds those predictions into planning decisions. It's broader than demand forecasting alone, which focuses only on customer demand.
The category exists because supply chain decisions depend on more than knowing what customers will buy. A factory needs to know what raw materials will arrive on time, what capacity will be available, what lead times to expect from each supplier, and what returns to plan for. These are all forecasting problems, and they share enough methodology (time series, ML, external drivers) that integrated tools cover them together.
This page explains what supply chain forecasting software covers beyond demand, how it differs from dedicated demand planning tools, and where the boundaries actually fall between supply chain forecasting and adjacent categories.
Author :
Chinmay Narwane
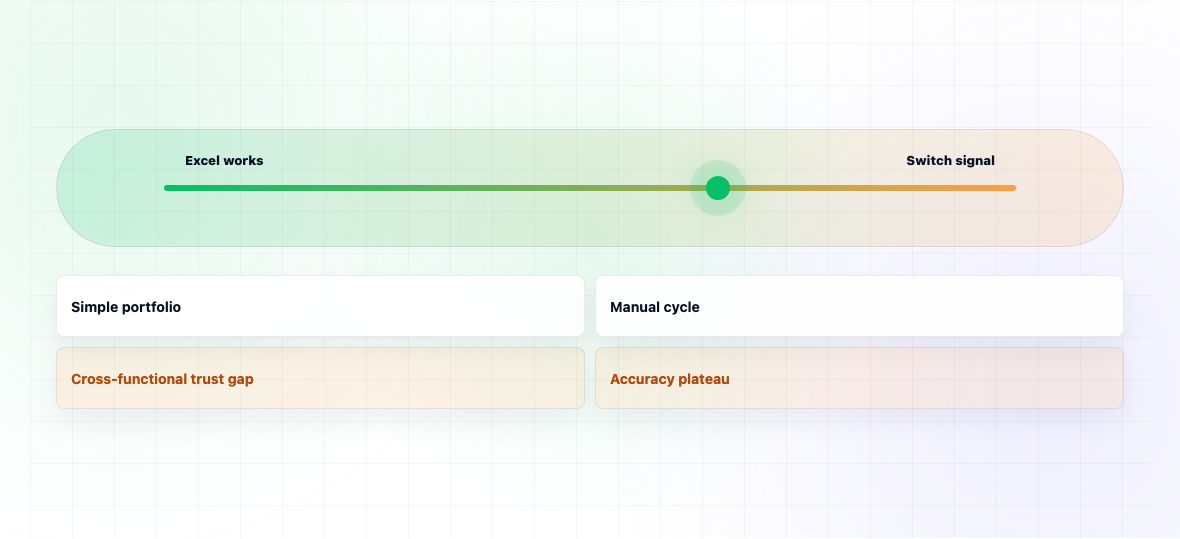
Almost every demand planning team starts in Excel. Most run into ceilings within 2-5 years that Excel cannot resolve regardless of how skilled the user is. The question isn't whether Excel is "good enough" in some abstract sense it's whether the specific company has crossed the thresholds where dedicated software pays back, and whether the team is spending more time fighting the spreadsheet than fixing the forecast.
This page compares Excel and dedicated demand planning software on the five dimensions that actually matter, then describes the four signals that say it's time to switch. The intent is not to make a sales argument for software it's to help a planning leader decide honestly which side of the threshold their company is on.
Some businesses can run effectively in Excel for years. Others have crossed the threshold and are losing money to it without realising. Both situations exist.
Author :
Chinmay Narwane
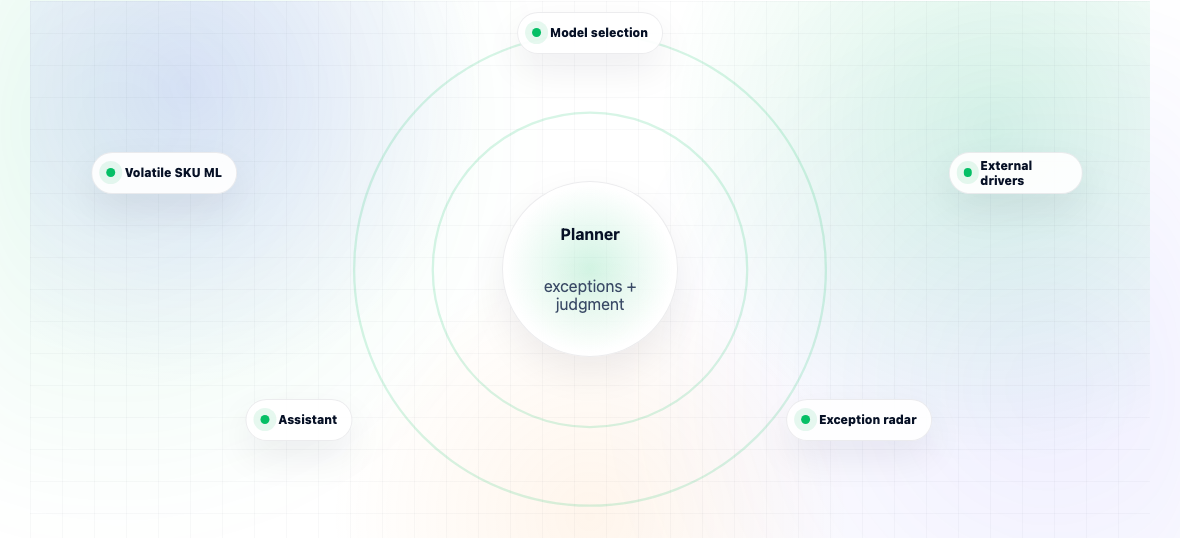
"AI in demand planning" is a phrase used to cover many things, some genuinely transformative and some marketing-only. Five specific capabilities account for almost all the real impact: automatic model selection per SKU, machine learning forecasting on volatile SKUs, integration of external drivers, exception detection, and conversational planning assistants. The rest is mostly relabelling existing capabilities with an "AI" prefix.
This page explains each of the five capabilities, where they add measurable value, where they don't, and what to ask vendors to separate substance from marketing.
One framing point worth stating upfront: AI does not replace the planner. It changes what the planner spends time on. Without AI, planners spend 60-70% of their time on routine forecast generation and review. With AI well-implemented, planners spend 60-70% of their time on exceptions, overlays, and reconciliation the work where human judgment actually adds value.
Author :
Chinmay Narwane
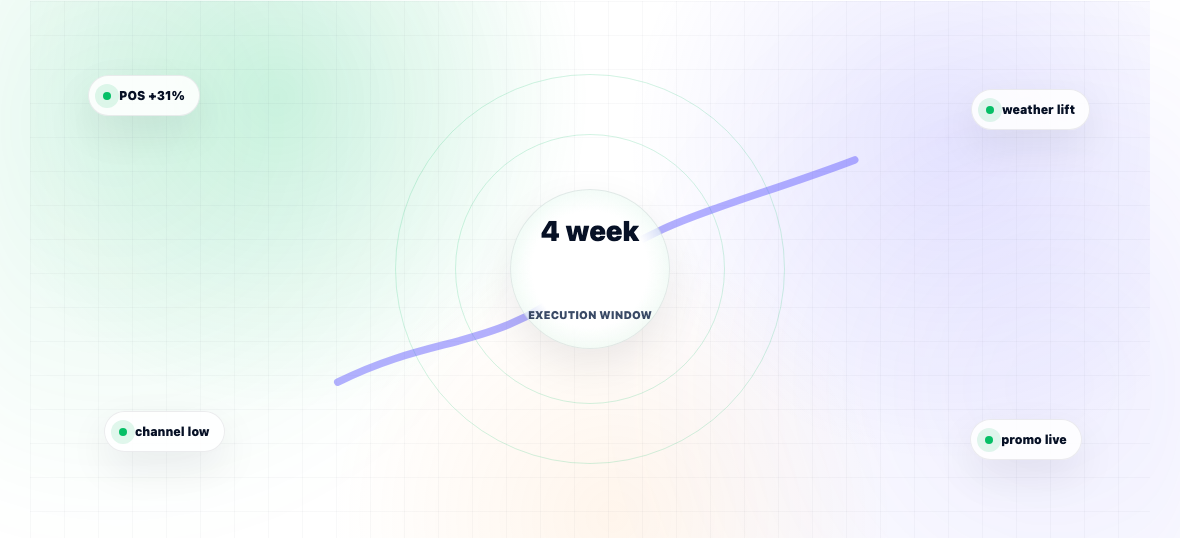
Demand sensing is a short-horizon forecasting technique that uses near-real-time signals point-of-sale data, channel inventory levels, weather, web traffic, social signals to refine the demand forecast over a 1-4 week window. It complements rather than replaces traditional medium-term forecasting, which operates on a monthly cycle.
The term gets used loosely. Vendors sometimes apply it to any short-term forecast adjustment. The technically correct definition is narrower: demand sensing models specifically use leading indicators that traditional statistical methods don't consume, and they refresh on a sub-weekly cadence so the operational supply chain can react before the medium-term forecast cycle would.
This page covers what demand sensing actually does, where it adds value (and where it doesn't), and what the implementation realistically requires.
Author :
Chinmay Narwane
Improving forecast accuracy in a manufacturing environment is mostly not about better algorithms. It's about cleaner data, better SKU segmentation, structured overlay capture, and a feedback loop between accuracy measurement and the next forecast cycle. Companies that invest in better algorithms before fixing those structural issues usually see disappointing results.
This page lays out the seven steps that, in our experience across mid-market and enterprise manufacturers, account for the majority of accuracy improvement. They're ordered roughly by impact and by sequence earlier steps unlock the later ones.
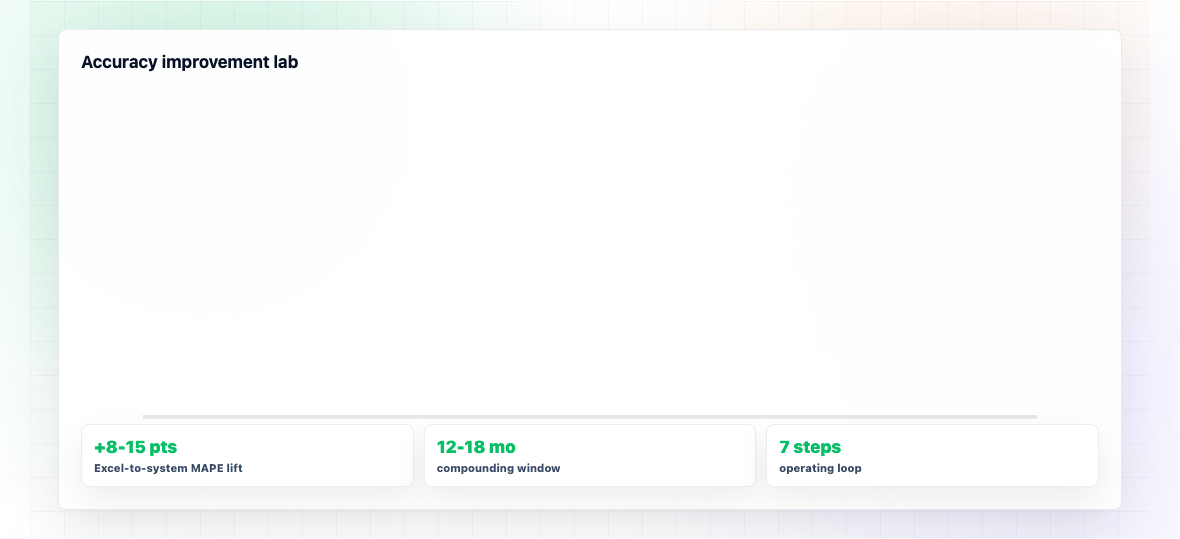
A realistic expectation: companies starting from Excel-based forecasting typically gain 8-15 percentage points of MAPE improvement over 12-18 months by working through these steps. Companies already on dedicated software typically gain 3-7 points. Neither pattern is dramatic in a single cycle accuracy improvement compounds.
Author :
Chinmay Narwane
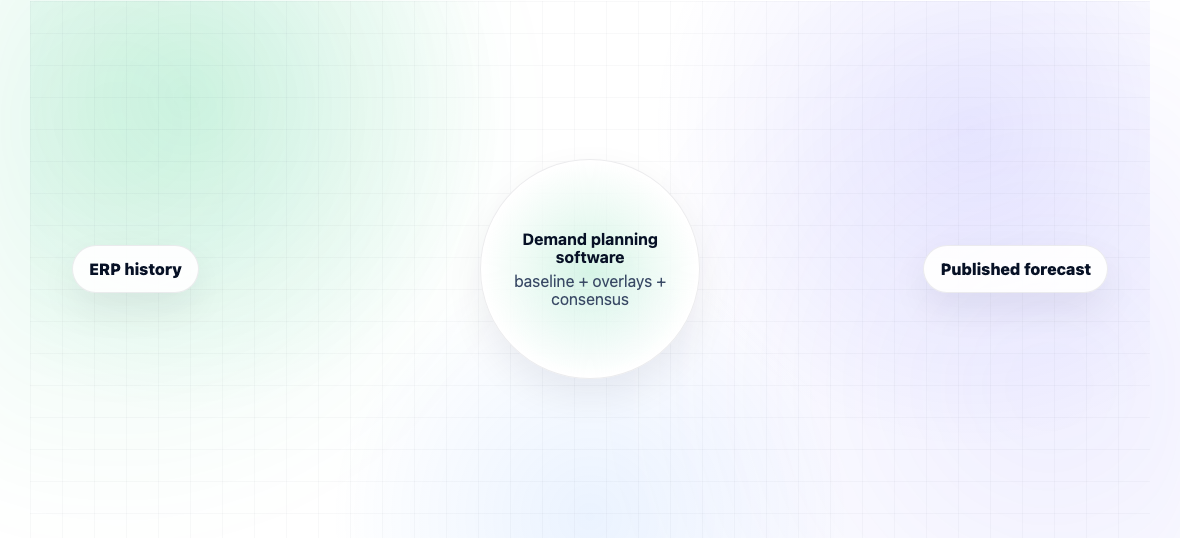
Demand planning software is a category of applications that automate statistical forecasting, capture collaborative inputs from sales and marketing, and produce a single agreed demand plan that operations and finance can execute against. It sits between raw sales history (which lives in ERP or data warehouses) and the supply planning process (which consumes the forecast).
The software replaces the spreadsheet-based forecasting that most companies start with. Where Excel can produce a forecast, it cannot enforce a process, store overlays with named owners, calculate FVA, or reconcile multiple hierarchy levels simultaneously. Demand planning software does all of those.
This page covers the six core capabilities that define the category, how the software differs from ERP forecasting modules and Excel, and what to expect from a modern implementation.
Author :
Chinmay Narwane
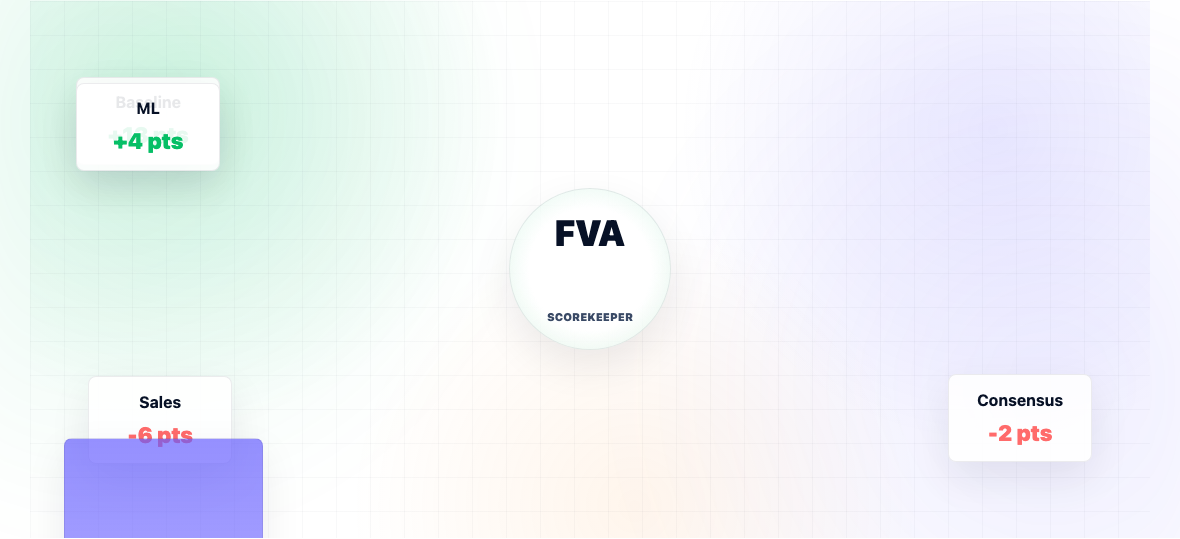
Forecast Value Add (FVA) measures whether each step of the forecasting process statistical baseline, ML adjustment, sales overlay, consensus actually improves the forecast or makes it worse. It compares the accuracy of each step against the previous step and against a naive baseline (typically last period's actuals).
FVA exists to answer a question most companies avoid asking out loud: are our overlays helping? Demand planning teams spend significant time gathering sales input, marketing intelligence, and management overrides. FVA tells you whether that effort is paying off or whether the final consensus forecast is actually worse than the unmodified statistical baseline.
The answer surprises most teams the first time they measure it. Roughly 40-60% of sales overlays, in our experience and in published industry data, destroy forecast accuracy rather than improve it. FVA is how you find out which ones.
Author :
Chinmay Narwane
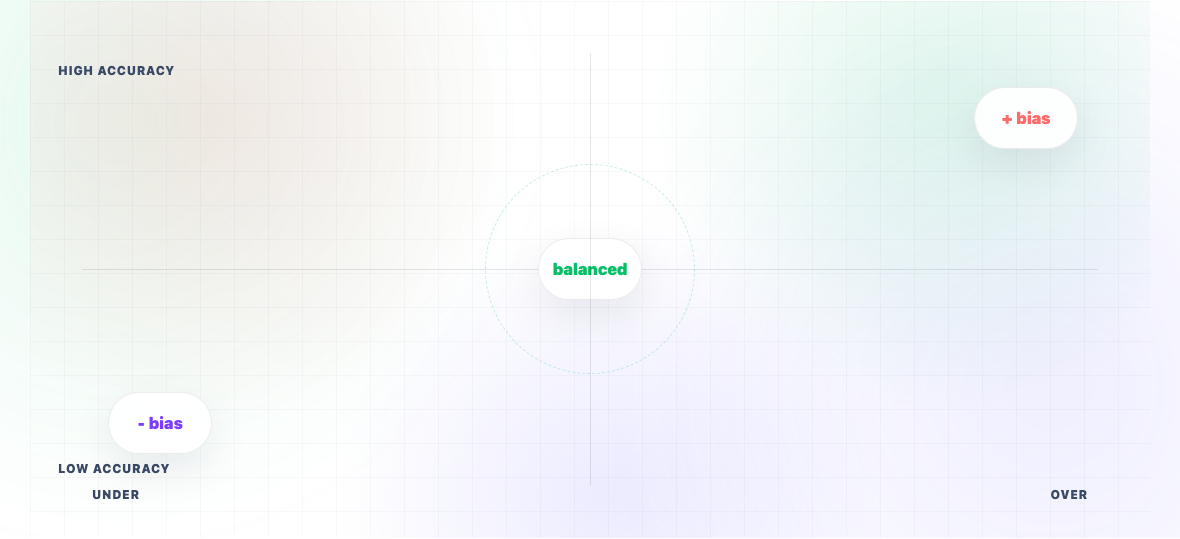
Forecast bias is a systematic tendency for forecasts to be consistently higher or lower than actual demand. A forecast with positive bias is chronically too high (over-forecasting). A forecast with negative bias is chronically too low (under-forecasting). Bias is the directional signal in forecast error accuracy tells you how big the errors are, bias tells you whether they lean one way.
The reason bias is dangerous: random forecast error averages out over time, but biased error compounds. A forecast that's 10% too high every month doesn't average to zero it produces a steady buildup of excess inventory. A forecast that's 10% too low every month produces persistent stockouts and lost sales. Bias is the kind of error a business actually feels in the P&L.
This page covers the formula, how to interpret it, where bias usually comes from (the answer is usually human, not algorithmic), and the four-step process to eliminate it.
Author :
Chinmay Narwane
Demand planning software is a category where the marketing materials look almost identical across vendors. Every product claims AI, fast deployment, and dramatic accuracy improvement. This guide is the inside view of what actually differentiates products, what to test in a proof-of-concept, and where buyers most often regret their decision twelve months in.
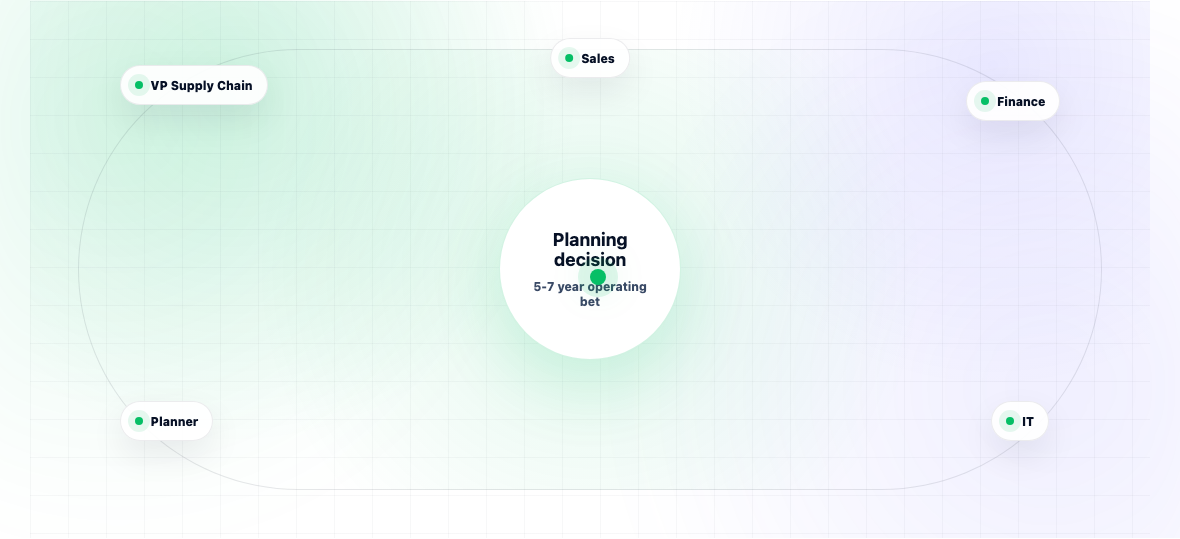
It's written for the buying committee at a mid-market or enterprise manufacturer typically a VP of Supply Chain or Head of Planning, the finance partner who has to sign the budget, and an IT leader who has to integrate it. The guide does not name competitors page-by-page (the category moves fast and rankings shift), but it covers the eight capabilities that matter, the four red flags to watch for, the typical TCO breakdown, and the questions to ask in a vendor demo.
You'll come out of this guide with a structured evaluation framework, not a recommendation. The right product depends on company size, complexity, ERP environment, and team maturity.
Author :
Chinmay Narwane

