Demand planning best practices and the challenges still unsolved: three planners compare notes
About the panellists
Jessica Seurinck is S&OP manager at Inve Aquaculture. Mike Mather owns and runs demand planning at MegaFood. Arun A leads the demand planning team at Mankind Pharma, after planning transformations at AB InBev and Mondelēz International. Watch the webinar.
Lists of demand planning best practices tend to come from consultants. This one comes from three people who run the process every month, in industries that could hardly be more different: Jessica Seurinck, S&OP manager at Inve Aquaculture, which supplies nutrition and health products to fish and shrimp farmers worldwide; Mike Mather, who owns and runs demand planning at MegaFood, a premium vitamin and supplement manufacturer in the United States; and Arun A, who leads eight demand planners at Mankind Pharma in India after planning transformations at AB InBev and Mondelēz International. In a Horizon roundtable they compared what works and what they still cannot solve. This article sorts their experience into practices with evidence behind them, and challenges that are open in every one of their companies. The replay is on the webinar page.
Best practice 1: people and process first, the system later
Arun’s first rule, from transformations at three companies, is sequencing. Bring the people and the process first: train planners to work in a defined way, with weekly and monthly reviews and S&OP, until collaboration with marketing and sales in demand shaping is routine. Let that stabilise for six months to a year. Then bring in the statistical or machine learning system. Doing it the other way round stacks every change on the same day, resistance sets in, people conclude it is not working, and the implementation fails, which in his experience is how a lot of implementations fail. His second rule follows: involve the end users, down to the analysts, from the beginning, because a consultant’s one-size-fits-all design never fits the details of a specific business.
Best practice 2: know whether you shape demand or not
Mike’s observation over seventeen years in consumer goods settles the perennial question of statistical against collaborative forecasting. Absent a substantial change in sales or market direction, the statistical or AI forecast is more accurate the less the organisation shapes its own demand. Where a company controls the levers of price, promotion and distribution, the collaborative forecast tends to win, because the people pulling the levers know what is coming. MegaFood sits towards the unshaped end, so its statistical model does well. A planner’s first job is to place the company on that continuum before arguing about method.
Best practice 3: close the product lifecycle loop
When Inve started S&OP, the product department was not part of the demand planning process. New product introductions, launches and end-of-life decisions reached the planners late or not at all. The fix was a regular meeting with the product department, monthly and biweekly around a launch, that categorises launches and phase-outs, puts a timeline on them per geography, and feeds them into the demand review with the planners and sales, and from there into the supply review. In a smaller organisation the SKU count makes this manageable in meetings; Jessica describes it as management by exception, because a launch has no history and cannot be left to a model.
Best practice 4: pay for the data you need
Collaborative forecasting depends on information other people hold, and all three companies have found a way to pay for it. Inve has spent years persuading distributors to share their inventory data, with sales giving them incentives, and it is starting to pay off. Its sales team carries a forecast accuracy objective in its bonus. Mike’s best-performing employers put about 10% of the sales bonus on operational forecast accuracy. Mankind Pharma gives key accounts additional margin for sharing their secondary, sell-out data, which shows the true demand in the market, and puts 5–10% of the sales objective on forecast value add. Small weights, all three note, but a start, and only possible with commercial leadership that backs the process.
Best practice 5: segment, clean, then model
Arun’s data rules are plain: regular outlier cleansing, reviewed by the planners; parameters maintained; and no single statistical model for everything. Segment by the variability of the history and by volume or value contribution, and tune models per demand pattern. He applies the same staging to machine learning. A company doing moving averages in Excel gains nothing by jumping to machine learning; move first to statistical univariate models, establish that they work, and bring in machine learning where it adds value, which is in finding the drivers and quantifying their impact. Without driver data, in the right format and granularity, machine learning is garbage in, garbage out.
Best practice 6: measure forecast value add, and go touchless where it is negative
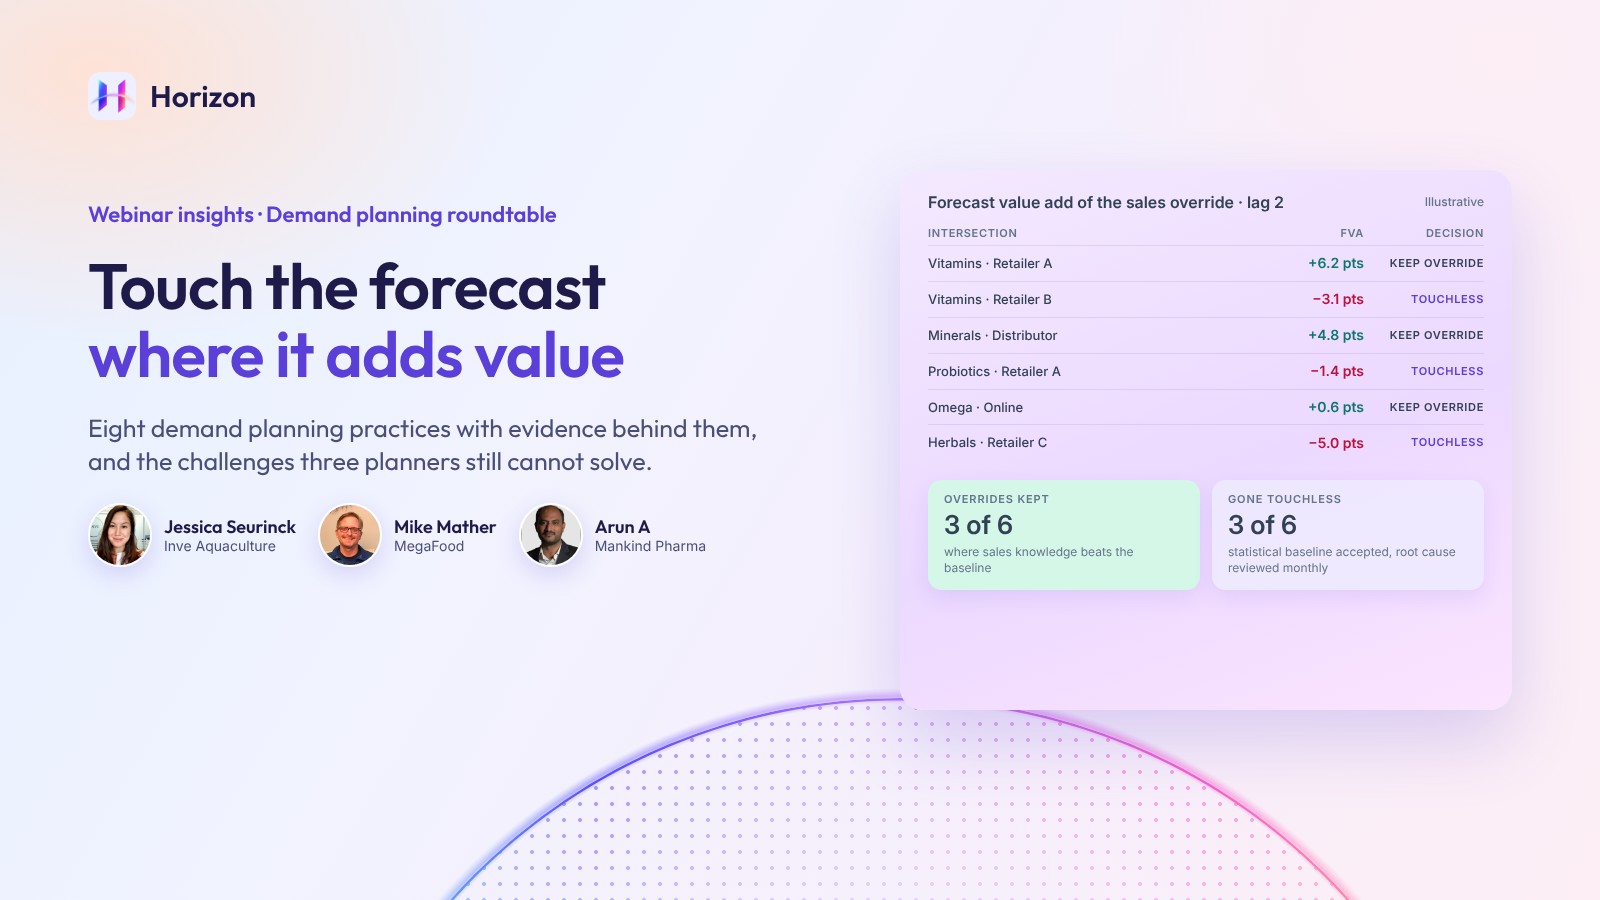
Mankind Pharma’s process starts with the market and the next three months’ marketing plan, generates the statistical forecast, adds the building blocks, and sends it to sales and marketing for enrichment. Forecast value add is measured at each level and reviewed monthly. Where the statistical accuracy is consistently good and the overrides add negative value, those intersections go touchless. Where the overrides add value, a root cause analysis asks why the model underperforms there, and the model is improved. The point is not touchless forecasting as a goal; it is directing human attention to where it earns its keep. The Horizon article on accuracy, bias and forecast value add describes the measurement.
Best practice 7: start with internal drivers, test outside the system
On drivers, Arun and Mike give the same order of operations. Internal data first: promotions, pricing, seasonality, field force changes, anything the company itself did. Then external: weather, GDP, demographics, inflation indexes, and for a consumer goods supplier, customer inventory, which in Mike’s experience correlates better than point-of-sale data, with competitive pricing second. Run the correlation analysis as a pilot, at the granularity you plan at, and drop the drivers that show nothing, before loading thirty variables into the planning system and clogging it with noise. Mike’s favourite example is a company during lockdown that found its store sales tracked miles driven, obtained the transport department’s forecast of freeway miles for the coming months, and forecast brick-and-mortar sales from it with high accuracy. Arun’s warning on the same theme: a driver used for the future has to be forecast itself, weather being the obvious case, so the longer the horizon, the more uncertainty the driver adds.
Best practice 8: monthly before weekly, and full data in every test
Mankind Pharma runs its statistical plan over 18 months in monthly buckets, and Arun’s advice is to start monthly and move to weekly only when the organisation is mature, because the weekly level is where the inventory reduction is unlocked and the return on the system is earned. Inve plans monthly over 12 months, and would like to go further for ingredients with long lead times, but biological variability on the customer side and the maturity of a smaller industry set the limit for now. Arun’s last rule comes from the implementation side: test and run user acceptance with a full data load, never a partial pilot. A consultant’s pilot on a subset can look good and fall apart on the full data.
The challenges still open
Point of sale does not predict orders. POS-based forecasting should be the most sensible method: sell-through, stock on hand, open orders, weeks-of-cover targets, and the order forecast falls out. In practice, Mike says, as a former buyer himself, buyers do not buy the POS. Open-to-buy budgets, year-end financial constraints, hedging to secure inventory, minimum order quantities and personal habits all shape the order. A statistical model on orders often captures that buyer behaviour better than a POS model does.
Launches are pushed and under-forecast at once. Inve gets pressure from above to launch before the product is ready and has to push back and defend the introduction process. At the same time salespeople, not wanting to commit, underestimate launch volumes. Mike adds the quieter version: company-wide launches and discontinuations are communicated with rigour, but when an account places an existing product late, or quietly reduces its footprint, nobody tells the planner. Arun’s numbers explain the caution: new product success rates are 15–20% at best, so the launch forecast blends judgement with route-to-market calculations and cannibalisation, is deliberately moderate to avoid year-end write-offs, and every new SKU is nurtured for a full year.
The black box. Mike measures accuracy extensively and can show an account manager that the statistical model beats the account plan, a naive model and the account’s own forecast. The answer is still, often, that it comes from a black box, so the account manager keeps their number. Arun sees the same from the other side: planners struggle to say what share of growth came from promotion, what from price, what from seasonality, because several drivers act at once and external forces are often not in the model. Machine learning helps by testing a hundred drivers for correlation, but quantifying each effect is still not fully solved.
Adoption. Marketing colleagues in the office pick up a new system quickly; a sales force trained over video calls does not. Mankind Pharma budgets two to three months of hand-holding and in-person sessions. For a sales team, S&OP is, in Jessica’s words, an educating role, and a soft skill.
The supply side moves. Inve ships from two factories to affiliates worldwide, and transit lead times have grown with the Red Sea crisis and the drought in the Panama Canal, so the company carries safety stock and safety time against demand uncertainty and lead-time uncertainty together. Demand itself depends on disease outbreaks at farms, global shrimp and fish prices, inflation pushing consumers to cheaper protein, and tariffs.
Choosing a system
Arun has sat on two selections. His criteria: ease of use for planners, availability of implementation resources in the market, the accuracy the system delivers in the pilot, optimiser capabilities that turn into money, and the right degree of customisation, enough to fit the business, not so much that the company ends up with non-standard ways of working. Mike starts with the return: a forecast accuracy improvement translates into units available to sell and into inventory not held, and standard formulas turn that into profit, which is the easiest way to win the CFO and the VP of operations. Beyond that, the packages look alike on AI, collaborative forecasting and external data, so he judges the soft side: whether the vendor’s people have planned for a living, and whether the vendor has a track record of going to bat for a customer’s unique need. Both value machine learning most for baseline and lift, for forecasting new products by analogy with similar items, and for driver analysis.
How Horizon reads this
Most of what the three planners want from a system is what Horizon’s HZN-1 engine does by design. Segmentation and model tuning are automatic: five model families compete, the best combination wins per item, chosen by backtest, with model choice and settings tuned automatically per item. The black box is answered with a deterministic engine, same data, same answer, and with stock-out recognition and links from signals to the affected items, so a planner can show an account manager why the number moved. And the sequencing Arun insists on is respected: Horizon Instant puts demand planning on your own data up and running in less than 24 hours, on the process the team already runs. Watch the full replay.