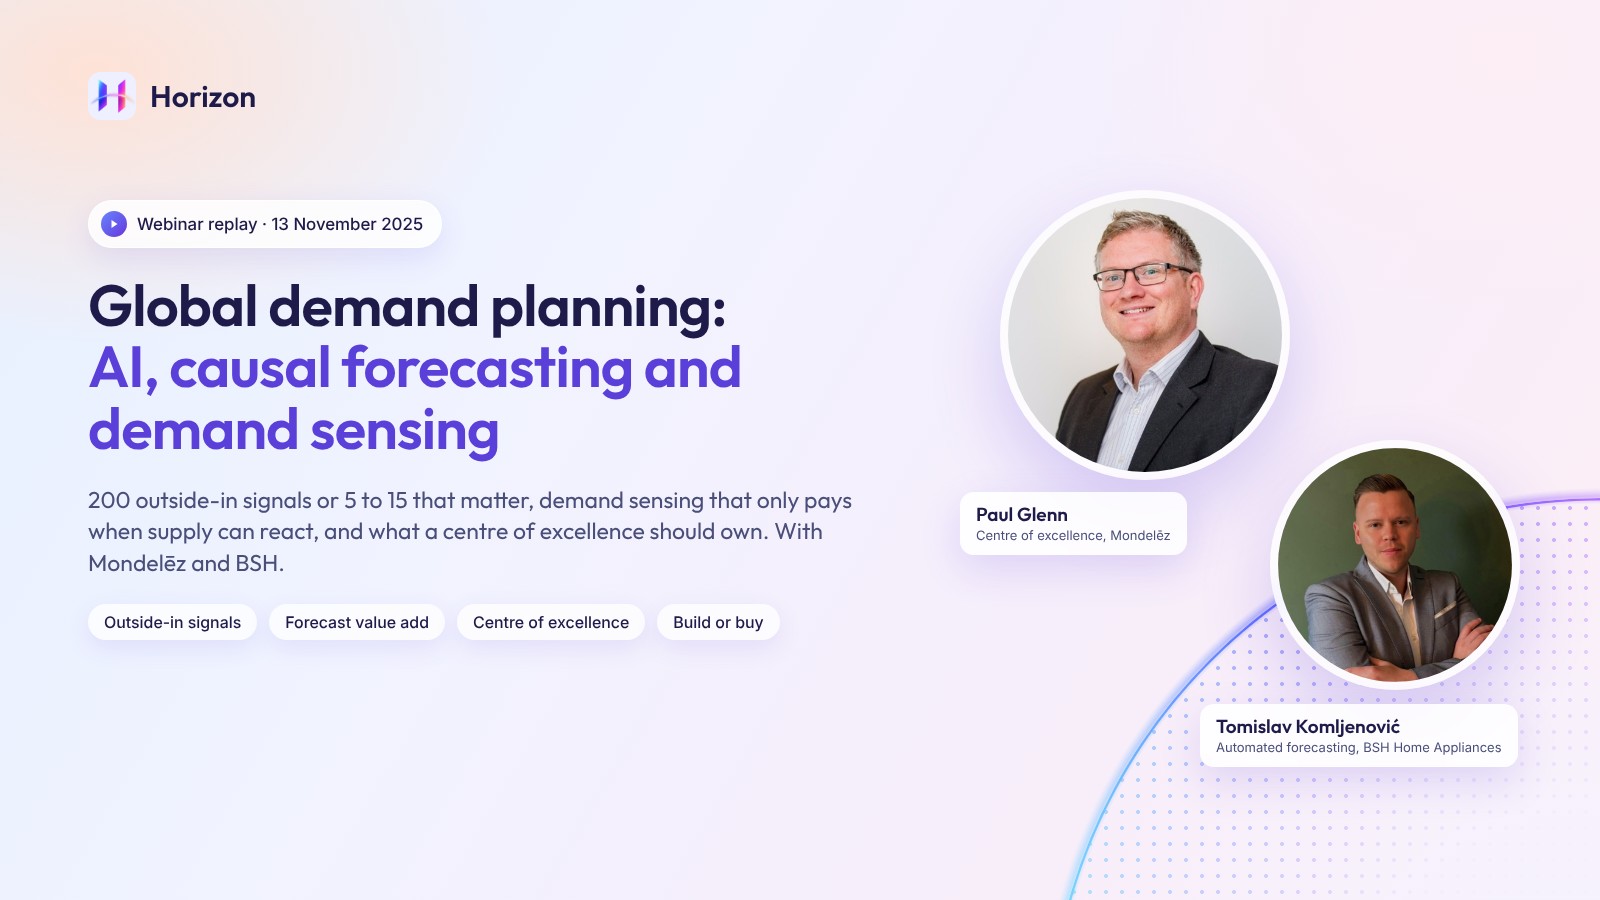
Demand sensing and causal forecasting at global scale: what Mondelēz and BSH learned

About the panellists
Paul Glenn led the demand planning centre of excellence at Mondelēz International, after planning roles at Jaguar Land Rover and Goodyear. Tomislav Komljenović is global process owner for automated forecasting and demand planning at BSH Home Appliances. Watch the webinar.
Demand sensing and causal forecasting get talked about as if they were the same thing: more data, better forecast. Two people who run them at global scale do not see it that way. In a Horizon webinar on global demand planning, Paul Glenn, who led the demand planning centre of excellence at Mondelēz International, and Tomislav Komljenović, global process owner for automated forecasting and demand planning at BSH Home Appliances, described two different setups that arrived at the same rules. This article pulls those rules together: what goes into a causal model, where demand sensing fits, what the value looks like after a few years, and how the planner’s job and the organisation change around it. The replay is on the webinar page.
Causal forecasting: which signals, and how many
BSH feeds around 200 outside-in indicators into its causal model. Komljenović groups them in buckets. Consumer signals: seasonal indicators, holidays and special days, exchange rates, social media data, consumer service data. Customer signals: sell-out price, customer sell-out, customer stock levels, and for some customers the customer’s own forecast. Most of it comes from open sources and paid services through APIs, refreshed monthly.
Mondelēz uses fewer. For a snacking portfolio the dominant signal is promotional activity, followed by pricing actions, competitor activity, distribution changes, new customers, seasonality and advertising campaigns, including sponsorship partnerships that drive events through the year. Glenn’s rule for the list is blunt: “Five to fifteen high-quality signals are better than fifty weak ones.” He treats demand signals like products. They are versioned, governed, and retired when they lose relevance. The reason is experience: a month after Mondelēz implemented advanced modelling in Europe, COVID arrived and the market, the product mix and every relationship in the model changed at once.
Both companies answer the “which signals matter” question with analysis rather than opinion. BSH runs correlation, impact and importance analysis on every forecast run, so the team can see how much each indicator moved the forecast and with what latency. Indicators that do not earn their place are dropped before they reach the model. The same analysis feeds explainability: when a forecast falls, the planner can see which indicator caused it.
Mondelēz does the same through people. A regional data science team meets the demand planners every time a new forecast is generated and walks through the drivers of the change. Driver reports in the planning tools quantify the effect of each factor. The purpose is to equip the planner for the demand review: when a commercial partner asks why the number moved, the planner can put the meat on the bones.
Demand sensing is a different job
Both panellists keep a sharp line between causal forecasting and demand sensing. At BSH the causal model owns the mid and long term. Demand sensing, using the functionality of their planning system, works within the month: it detects order patterns at weekly or daily level and matches the forecast consumption to how customers actually order. A monthly forecast can be accurate and still fail if one customer places 80% of its monthly volume in the first week, so sensing produces a more granular forecast that the MRP run can consume without errors.
Glenn adds the condition that makes sensing worth having. “Demand sensing buys you time to adjust to the varying conditions of the market. But it is only of relevance if your supply network can actually adjust and react to that signal.” With short shelf lives, a changed order can have significant effects downstream in manufacturing. If a product is on allocation, sensing tells you earlier about a demand you cannot serve anyway. It is still worth having, but the value sits in the reaction, not the visibility.
What the value looks like after a few years
The numbers are the panellists’ own. BSH measured the forecast value add of its outside-in setup against the traditional forecast it still runs in parallel: around ten percentage points of forecast accuracy at lag 3, in mix, and around eight percentage points at lag 6. Komljenović’s point is less about the number than about what it does to adoption. With the value add visible, planners accept the model: “you have the people on your side because they see that the external data supports us.”
Mondelēz is in its fifth year of machine-learning forecasting. At lag 3 to lag 6, the statistical forecast often outperforms the initial view of the market and of the demand planner, so the organisation is moving towards taking the statistical forecast directly as the operational forecast over those horizons. The planner’s value then concentrates in the short and medium term, where human information matters most.
That shifts the job of the sales team. Glenn’s view is that releasing sales from forecasting duties, including the SKU-level forecasts he has seen in other companies, turns them into the conduit for information that does not exist in any open source: competitor promotions, delivery blockages, what the customer said last week. External data is powerful, he says, but it has to be curated, localised, validated and tied to a decision.
Exceptions, overrides and the planner’s time
Automation without guidelines does not change how planners work. BSH wrote the guideline before the tool went live: colour codes that tell the planner whether a forecast needs attention, thresholds for when an automated forecast is trusted, and override tolerances. A planner may adjust a forecast, but within a defined band, so the freedom is real and bounded. The planner remains the last person who decides.
Mondelēz sets up the same governance with the markets and regions, with one refinement. Thresholds are expressed relative to volume, so the exceptions that surface are the 10, 20 or 30% changes on a large volume, not noise on a small one. “We want the planners to spend the time on the exceptions that actually matter rather than everything that exists.” The first task for a planner facing an exception is to understand why, which is where explainability and the black box perception meet.
Neither company has an AI assistant in production yet. BSH built its own causal environment outside the standard functionality of its planning system, so the vendor’s assistant has limited reach, and explainability is the first item on their generative AI roadmap. Mondelēz is moving to a new planning system in phases, with an assistant that tells a planner what to focus on today as an ambition for a later phase. Both see a first role for agentic AI in data preparation and quality checks, and in summarising and analysing data ahead of an S&OP cycle, rather than in the core modelling.
The planner as decision scientist
Glenn describes the direction as redefining and elevating the planner, not replacing them. The planner becomes the one who tells the story, who understands the commercial constraints and what is coming out of the model, who uses forecast value add to earn trust, and who coaches the system rather than beating it. Komljenović, who was a planner himself, says the same from the other side: he was a number cruncher, and the tool gave him the time to challenge marketing and the cross-functional departments and find the best fit for the company.
The change management is where it is won or lost. Glenn’s advice is to spell out the benefit for every function from the start: more time, better short-term numbers, a feedback loop into the model. Komljenović frames it more strongly. “AI is not a part of the transformation. AI defines the transformation.” BSH shows planners the time savings, the forecast value add, and the effect of a better forecast on service level and inventory, so that planners believe in the process because of the results, and enhancements are discussed with the people who use the tool every day.
Global versus regional: what a centre of excellence owns
Mondelēz operates in around 70 markets with more than 100 manufacturing sites and several hundred distribution centres, which is the scale at which a centre of excellence makes sense. Glenn’s warning is about what it becomes. A centre of excellence that acts as the police is a bottleneck. The one that works is an enabler: it scales good ideas across markets at different levels of maturity, through global communities of practice, and sets flexibility within a framework rather than one way of working. He also argues the case does not depend on being a giant: a multi-market region such as Europe has a reason to share practice; a single-site business does not.
At BSH the ownership of the plan stays regional, because the local planner knows the market and works with the business units, marketing and sales. Global owns the governance: KPIs, targets and best practices, with a business excellence function that tracks performance and raises the hand when targets slip. Both agree that standardisation has limits. Komljenović puts it as value add over conformity: a standard that fits one region and not another is not worth enforcing, as long as the variation stays under global control. Glenn’s phrase is that standardisation means compatibility, not sameness. If the CEO sits in a demand review in Indonesia and another in Costa Rica, 90% of what happens should be recognisable, and the end result is the same: a number the business believes in and an acceptable service to customers.
His practical tip for anyone setting up global governance: define the KPI catalogue first. Every KPI gets an owner, a standard definition, a tier of importance and regional stewards who are the point of contact, and all of that is documented before any reporting or data product is built. Otherwise the data exists and nobody knows what it means or whom to ask.
Build or buy
Both run a hybrid. Mondelēz has data scientists in centralised analytics and others sitting in regions who tune models and parameters, alongside packaged software. Glenn’s summary: “The winning model isn’t necessarily the smartest algorithm. It’s the one that learns the fastest.” BSH combines a data science team embedded in supply chain, which builds new models quickly, with standard packages that give automation and routine.
Forced to choose, both picked the data science team. Glenn’s reason is the human relationship: data scientists who can ratify the numbers and help the planners, while deliberately kept out of the demand review and away from the bombardment of rationales from finance and marketing. BSH has formalised the idea as a forecast improvement team that clusters data scientists with a process owner and a business partner; when a volatile order pattern breaks a forecast, that team finds the reason and defines the fix. Glenn’s caveat applies to anyone reading this from a smaller company: the two of them have the luxury of choice, and the right answer depends on where the company is in its evolution. For the algorithm question that always comes up, BSH’s general workhorse is gradient boosting, with best-fit selection per product-location, and Mondelēz uses what the product and its seasonality need, including ARIMA and nearest-neighbour methods for products sold once a year.
How Horizon reads this
Three things in this conversation line up with how Horizon’s HZN-1 engine is built. Models are selected by evidence, not by preference: in HZN-1 five model families compete (statistical, machine learning, deep learning, foundation models and causal models) and the best combination wins per item, chosen by backtest, with model choice and settings tuned automatically per item. Explainability is a property of the engine rather than a roadmap item: HZN-1 is deterministic, same data, same answer, and the signals behind a change are linked to the items they affect. And the planner’s time goes to exceptions that matter, which is what Deep Sensing is for: it reads the signals, models the impact, and ranks the priorities, so the planner starts the day knowing where to look. The webinar is a useful picture of what that takes when two large companies build it themselves. Watch the full replay.